Summary view
The summary view is accessed using the F1 shortcut and displays the most useful informations needed to perform a fast triage of the opened file. This is the first view displayed by default, although you can change this behavior in . The view is a report made of 6 parts, that we will describe below:
File layout
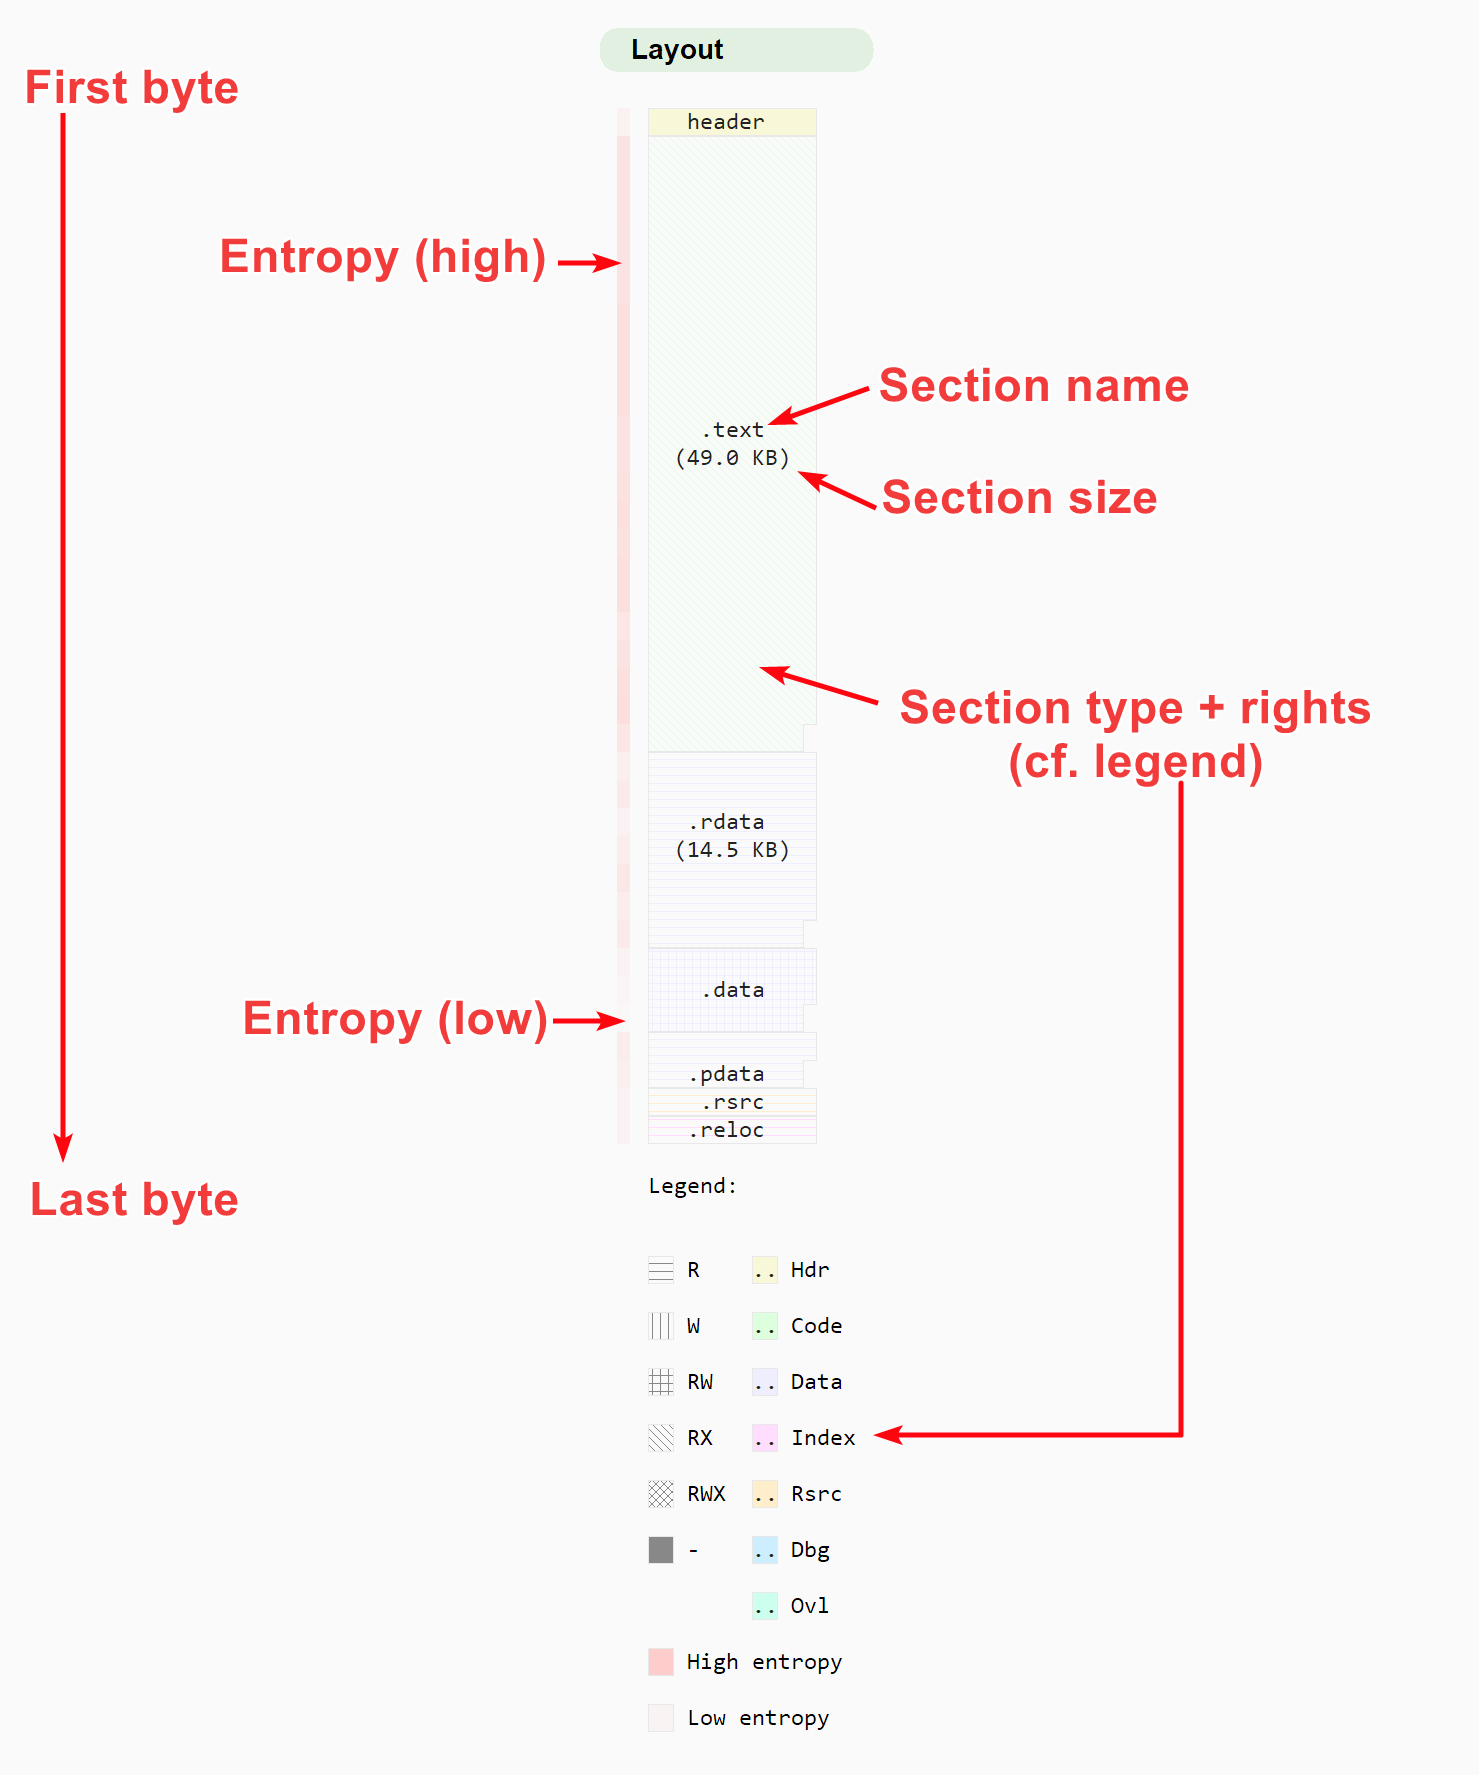
Malcat’s file format parsers cuts down the analyzed file in contiguous blocks named sections or regions. The section/region layout is represented on the left side of the summary view using a synthetic graphical display. All sections/regions are represented by vertically stacked named blocks, whose size is proportional to the corresponding section/region (but always at least 1 row high). Each block is made of the following attributes:
the name of the section/region
the region size if the section is big enough to span over two lines, otherwise the size is omitted for more readability (you know it is going to be small anyway)
a color code which tells you which type of section it is
a fill brush style which tells you the rights of the section: read, write, execute or a combination of the three
The section/region layout report
Left of stack of blocks, you can find a vertical bar which display the entropy of the file at the given location. It uses a color shade ranging from the theme’s background color (low entropy) to the theme’s selection color (high entropy). While less precise than the Augmented navigation bar, it should allow you to spot huge packed/encrypted blocks inside the file.
The layout report should be the first thing you inspect when analyzing a file. Sometimes, you can already say that a file is packed and/or obfuscated just by looking at the attributes and names of the sections along with their entropy:
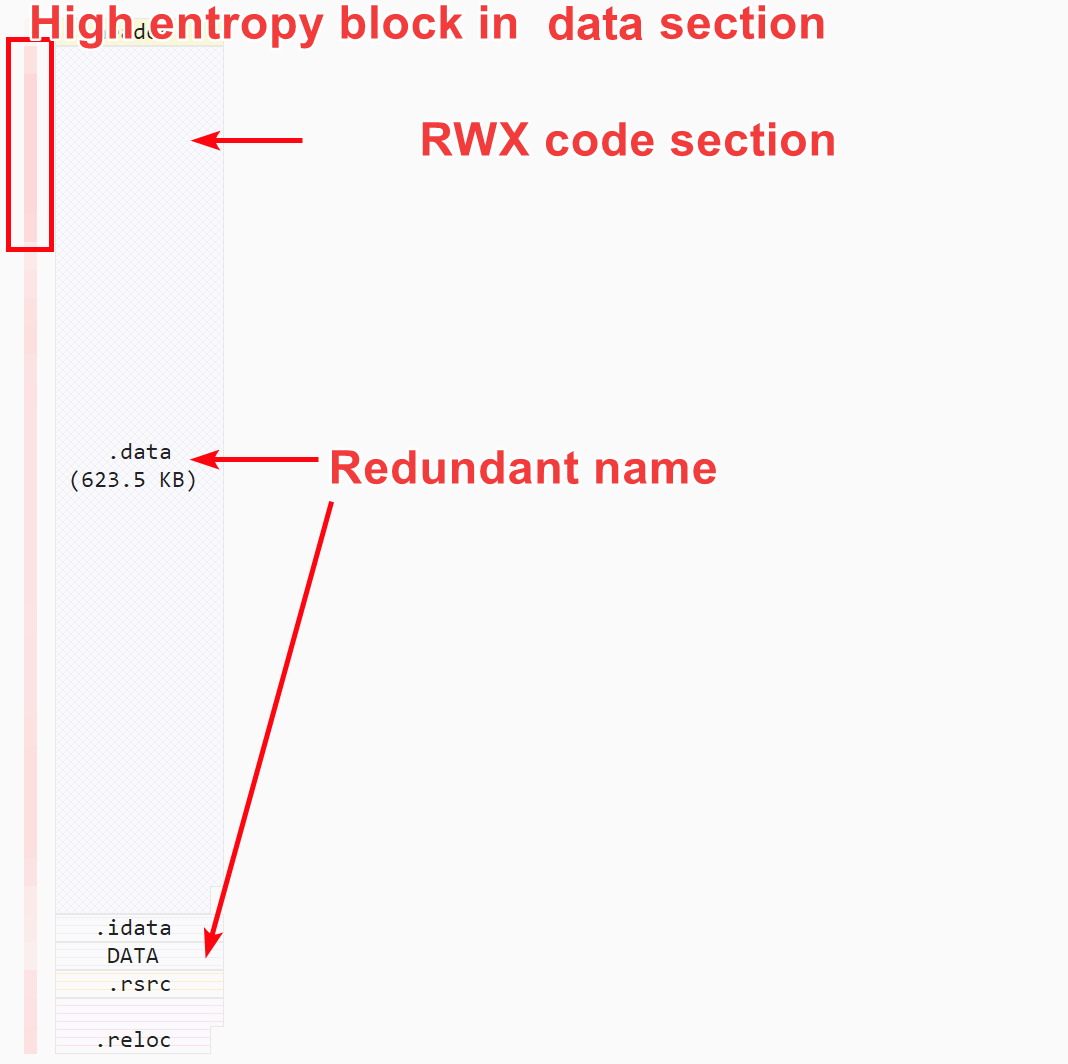
Section layout tells us already that the file is packed and most likely malicious
Basic file informations
Under the “File informations” panel, you will find the following informations:
Key |
Description |
|---|---|
File name |
file name of currently open file |
File size |
size of open file in bytes |
Type |
which file parser did match for this file (see File parsers). Should be “???” if the file format was not recognized |
MD5 |
md5 hash of file data |
SHA1 |
sha1 hash of file data |
SHA256 |
sha256 hash of file data |
TLSH |
TLSH hash of file data (see https://github.com/trendmicro/tlsh) |
Note that all these values can be copied into the clipboard: simply select what you want to copy and hit Ctrl+C.
File metadata
Metadata are extracted by the different File parsers and thus differ from file type to file type. They are used to give context to the file you are seeing like creation time, names, paths, certificates, etc. They can be grouped by category and can be copied into the clipboard: simply select what you want to copy and hit Ctrl+C.
Matching Yara signatures
The next summary section displays all matched Yara signatures for the current file. Yara hits are grouped by danger level using colored panels. Inside each panel, rules hits are further grouped into categories. When running Malcat for the first time, only Malcat’s defaults rules will be used there, but it is very easy to add your own Yara rules to the rule set (cf. Yara signatures).
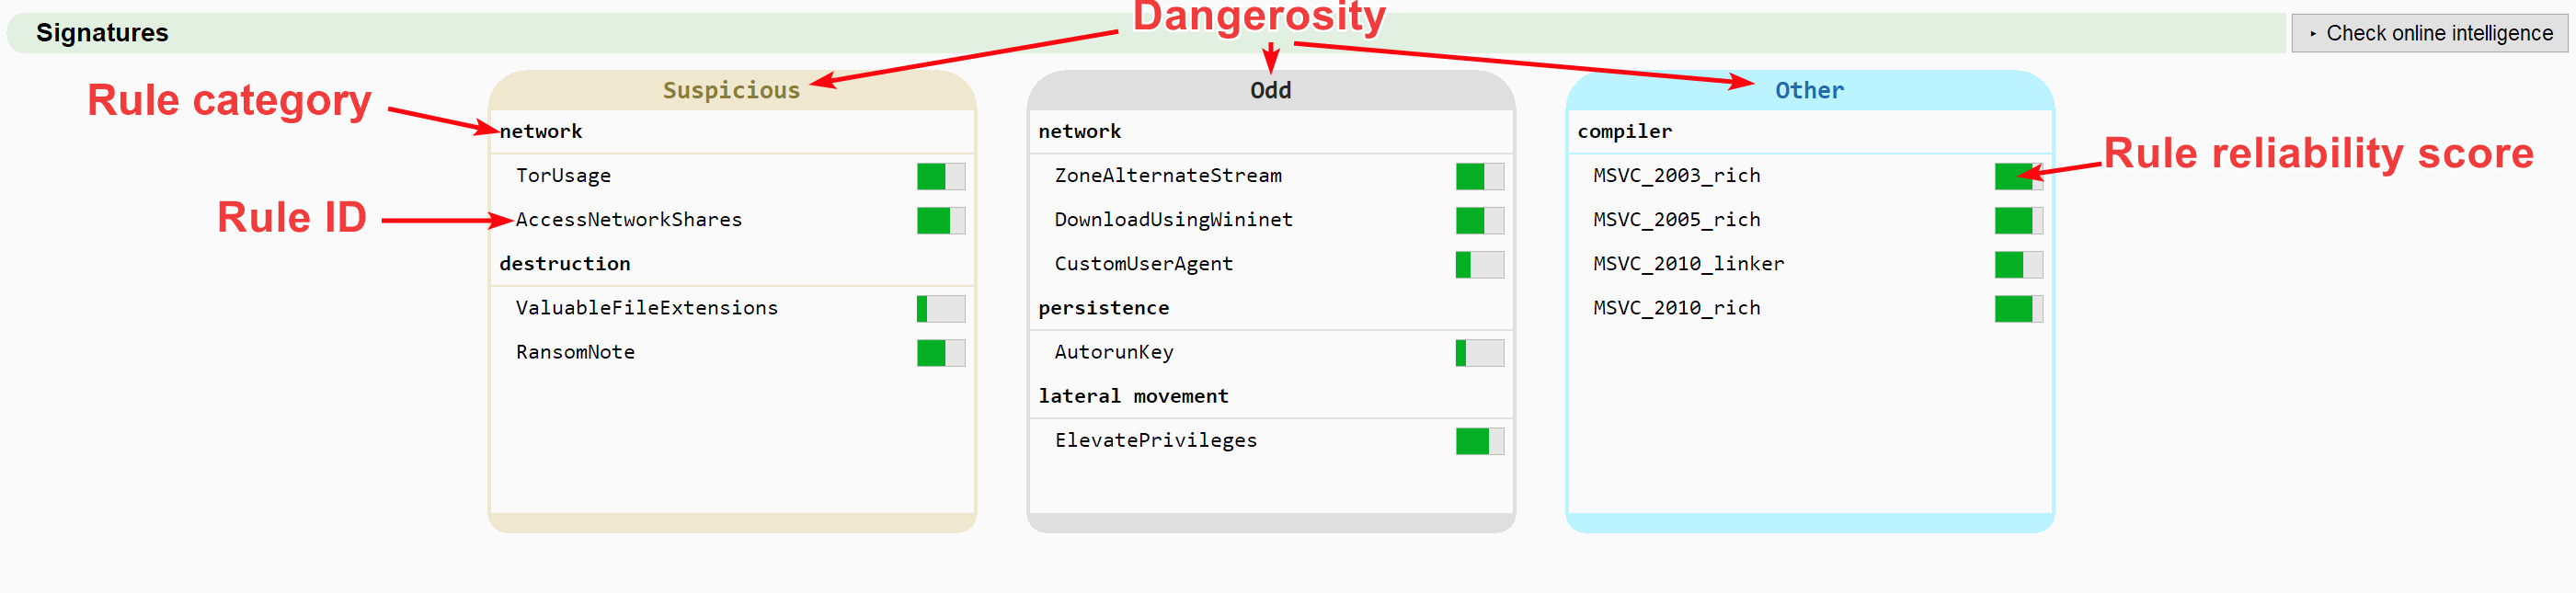
Matching Yara rules summary
The color code for the panels follows the following convention, depending on the Yara rule tag, which reflects the dangerosity of the identified element (see Yara signatures):
rule: malware, malicious, adware, apt, rat, ransom, ransomware, banker, trojan, virus, worm
rule: pua, tool, hacktool
rule: suspect, suspicious, heuristic
rule: odd, rare, weird, misc, unusual
rule: clean
rule: all other tags / no tag
By clicking a rule identifier, you will open the rule inside the quickview panel. From there, you can see the details of the rules, like its description, or all the matching elements. You can even open the rule inside Malcat’s Yara editor / browser for editing purpose.
You’ll also notice a Check online intelligence button there. It is a shortcut that will trigger Malcat’s Threat intelligence providers service and open the results inside the Threat intelligence report. Not that the threat intelligence service is only available in the paid version of Malcat.
Anomaly scanner
Malcat comes with a powerful Anomaly scanner. All discovered anomalies are listed in the anomaly panel, grouped by category. Anomalies identifiers are additionally printed using the following color scheme:
anomaly: anomaly found almost exclusively in malware or corrupted files
anomaly: suspicious anomaly worth looking at, rarely found in clean files
anomaly:: unusual anomaly / file property
anomaly: informative property
Clicking on an anomaly displays the internals of the anomaly in the quick view panel (bottom left of the window). There you can quickly look at the anomaly description and follow all locations where the anomaly was discovered.
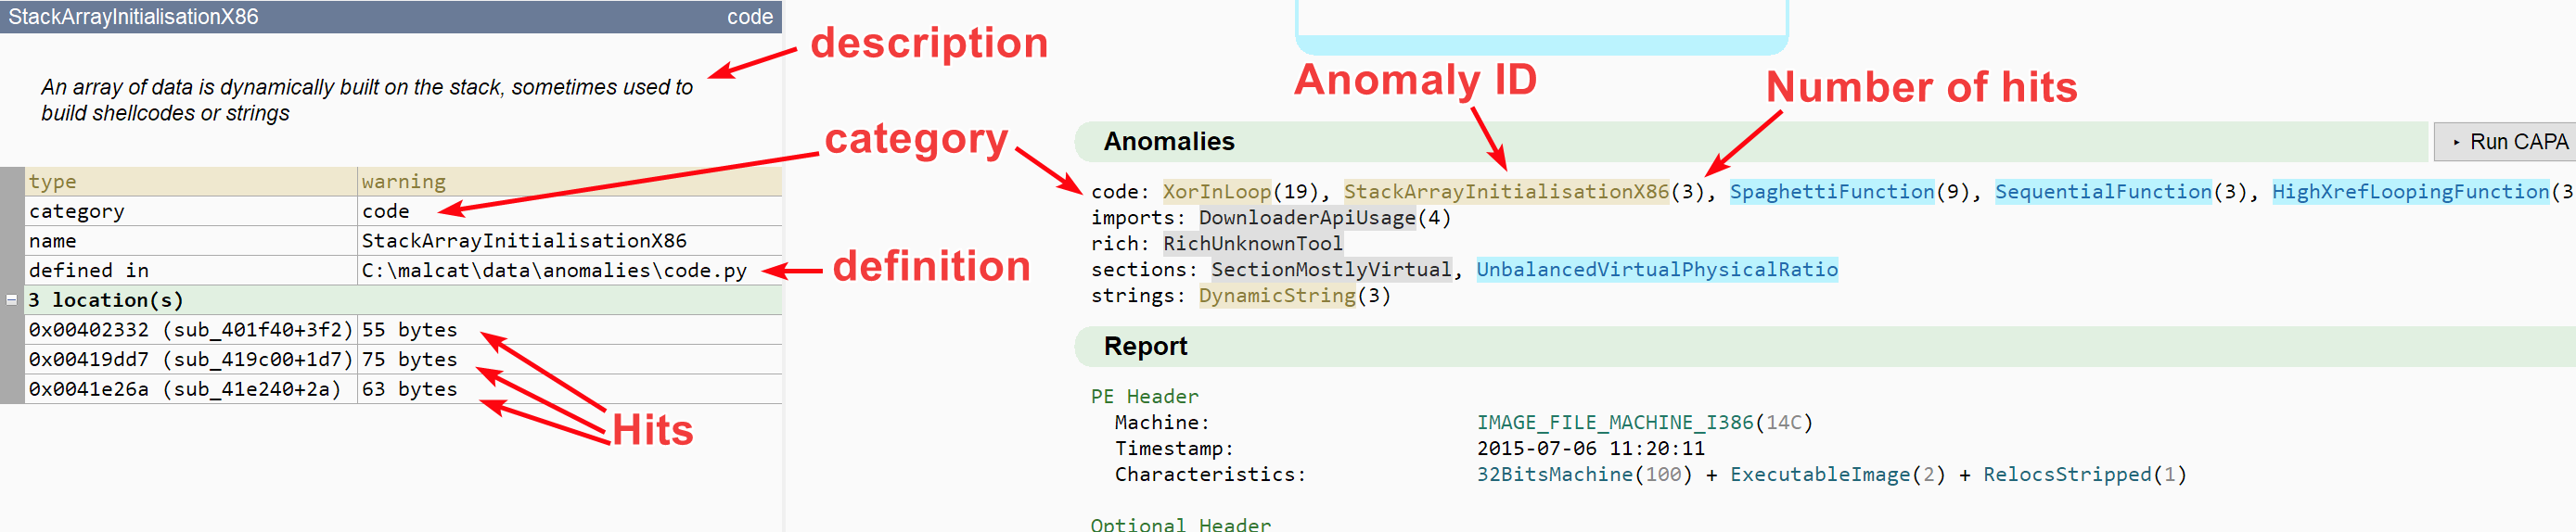
Displaying anomalies found in files
In the section header, there is also a button labeled Run CAPA. Hitting the button will run the Capa script by Mandiant, using bindings made for Malcat. Capa is a great tool which identifies file anomalies using a YAML-based signature set, but only for PE and ELF files.
Quick report
What is it?
While the Structure/text view is there to display the structures identified inside the file, scrolling through the entire file can be somewhat cumbersome. The report section is there to summarize the most important structures identified by the File parsers into a short and easy-to-read screen. It can also display pointers to the most interesting parts of the file that the user can click on for easy navigation.
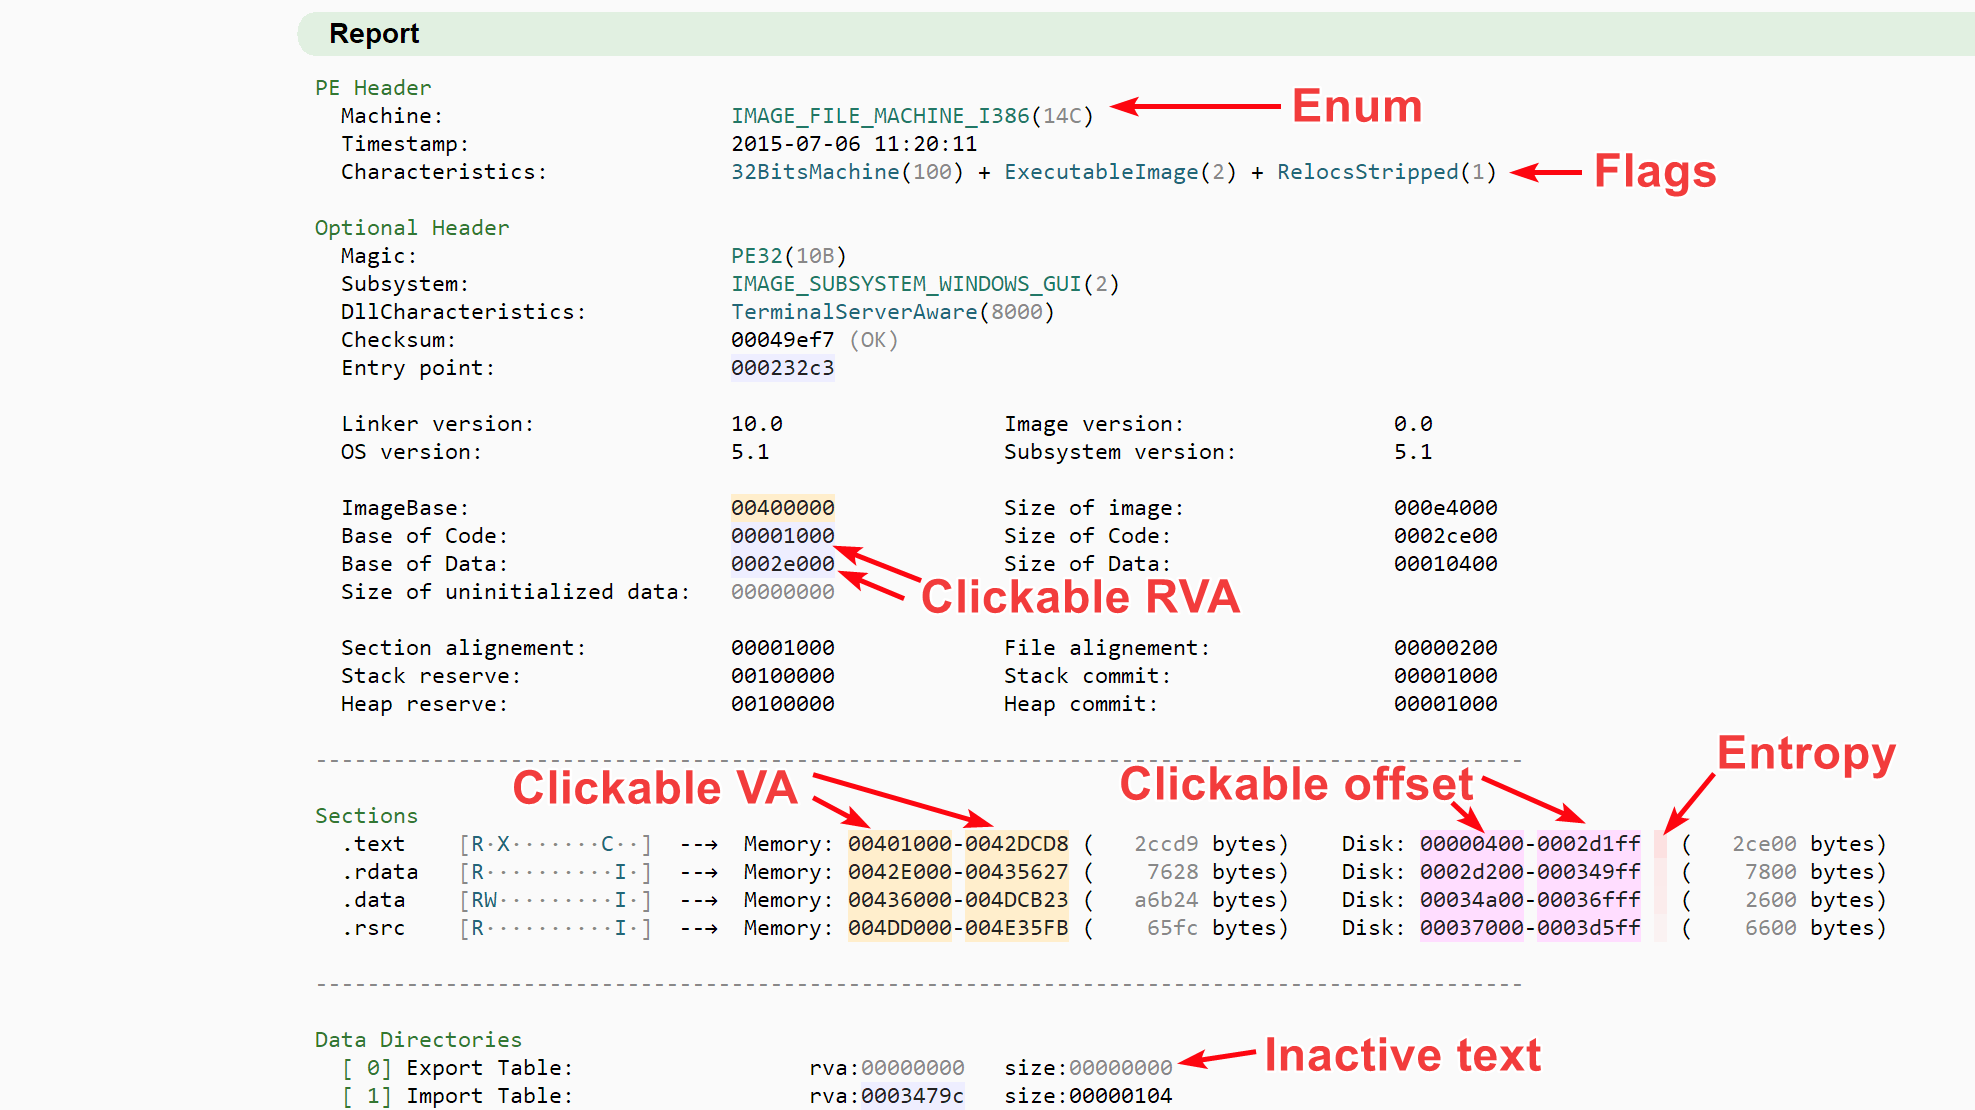
Quick report showing informations about a PE file
The report content is file-type dependent. Once Malcat has finished the analysis, the template located in data/templates/<filetype>.tpl is run. Template can be scripted in python and have access to the complete analysis result via the Analysis object (analysis).
If you want to change the way a report looks for a given filetype, you just have to customize the template file. For more information, refer to the Customisation chapter.
Write your own summary template
coming soon