Disassembly view
The disassembly view is accessed using the F3 shortcut and allows you to navigate through and edit the instruction flow inside the file. You can view any data, not just data identified as code by the CFG recovery algorithm, which could prove useful against obfuscated programs and exploits. You can click on the different labels or references to follow the control flow of the program.
Note
The disassembly view only displays byte which are present in the file. Purely virtual address space is not displayed.
The disassembly view being a standard view found in many other tools, we will only focus on the few less common features.
Viewing
Navigation
Navigating in the disassembly view is mainly done using the navigation keys or by clicking on labels like with any other disassembler. Additional keyboard shortcuts allow you to jump between function or basic blocks:
Shortcut |
Action |
|---|---|
← |
Go back 1 byte |
→ |
Advance 1 byte |
↑ |
Goto previous instruction |
↓ |
Goto next instruction |
Home |
Goto first byte in file |
End |
Goto last byte in file |
PageUp |
Goto back one page of disassembly |
PageDown |
Display next page of disassembly |
Ctrl+G |
Goto address (opens a dialog) |
Backspace |
Go back |
s or S |
Goto next/previous Section |
t or T |
Goto next/previous sTructure |
f or F |
Goto next/previous Function |
g or G |
Goto next/previous debuG info |
b or B |
Goto next/previous code Basic block |
o or O |
Goto next/previous sub-Object |
c or C |
Goto next/previous identified Constant |
r or R |
Goto next/previous stRing |
y or Y |
Goto next/previous matching Yara string |
a or A |
Goto next/previous matching cApa feature |
x or X |
Goto next/previous Xref |
d or D |
Goto next/previous Difference (only in diff mode) |
l or L |
Goto next/previous user Label |
h or H |
Goto next/previous user Highlight |
m or M |
Goto next/previous user coMment |
* or ? |
Goto next/previous selected area |
. |
Goto last modification and select it |
Ctrl+F |
Find pattern (opens a dialog) |
Ctrl+N |
Goto next search result |
Ctrl+Shift+N |
Goto previous search result |
n |
When hovering a function/global address -> rename function / add user label |
Quickjump
If you want to quickly follow control flow branches, Malcat also features additional shortcuts named quickjumps. The first 9 unique targets appearing in the disassembly view cam be followed By pressing the keys 1 … 9, enabling fast mouse-less navigation inside the CFG.
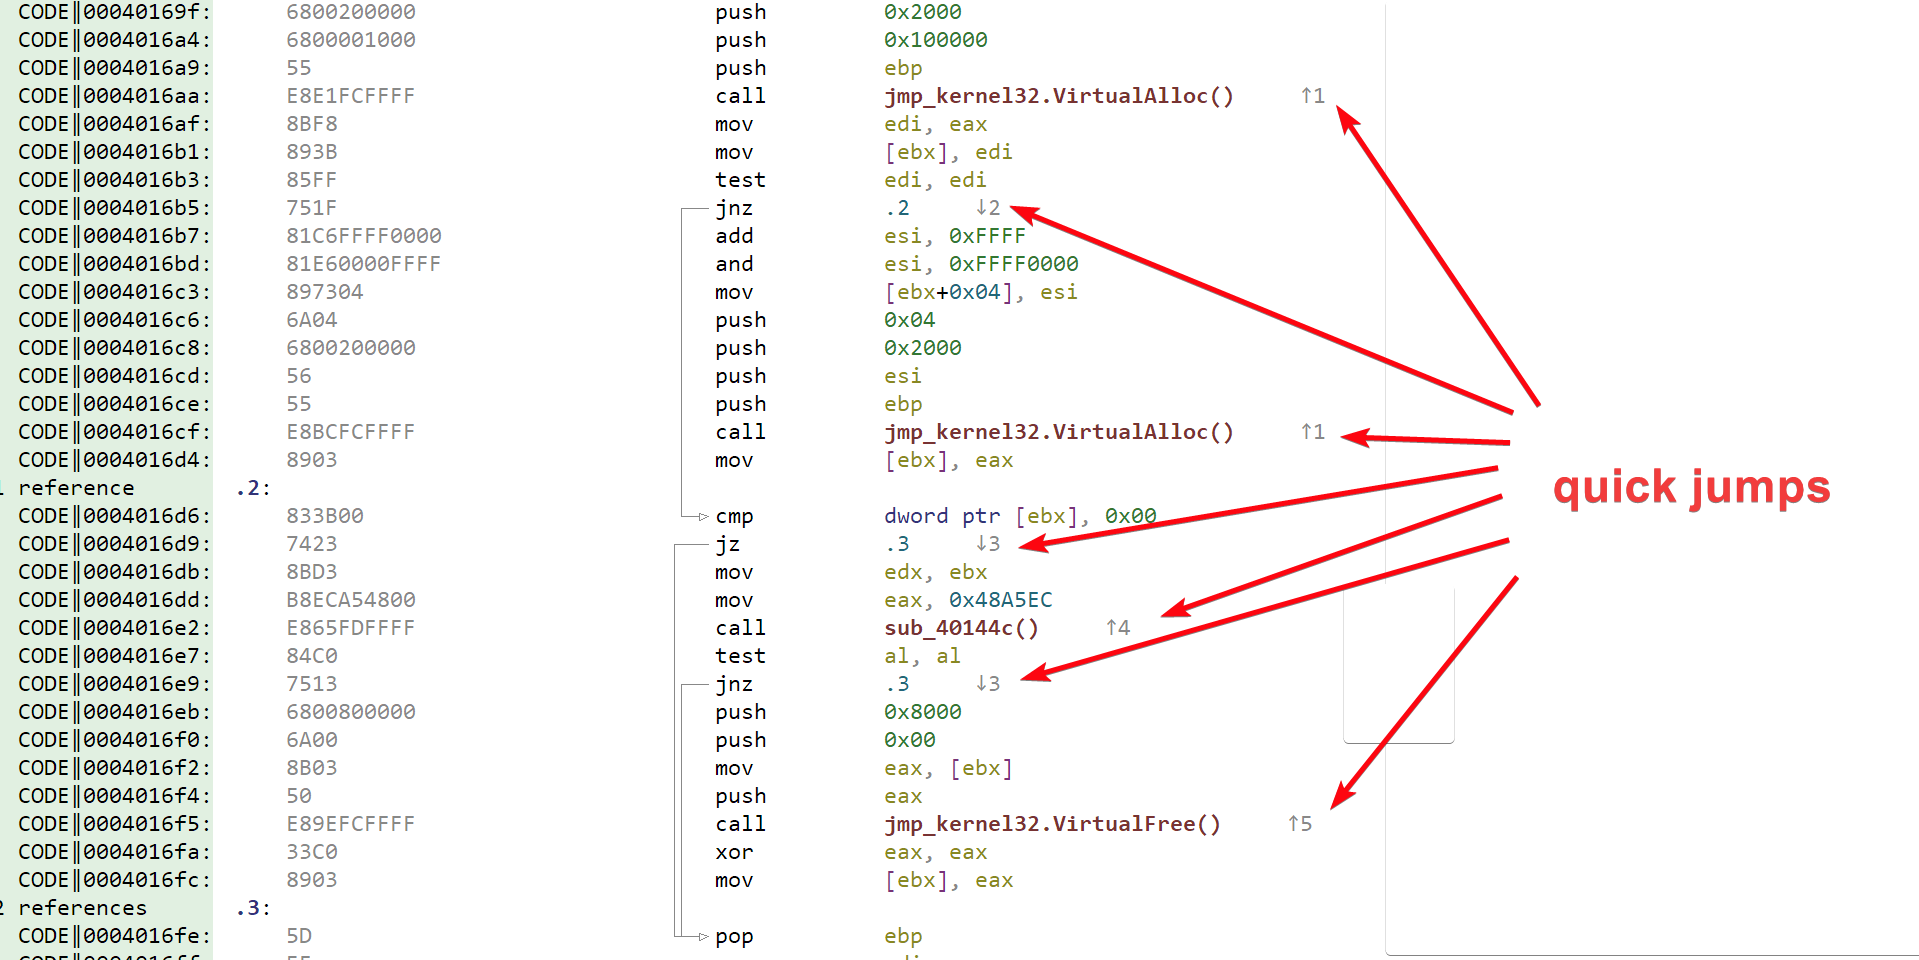
quickjump are keyboard shortcuts used tp jump to the first 9 visible targets in the disasembly view
As we can see in the picture, the quickjump-enabled target have their quickjump number printed directly after the target address, prefixed by an up arrow (e.g. ↑1) if the target is located before the current address, or a down arrow (e.g. ↓1) if the target is located after the current address.
Shortcut |
Action |
|---|---|
1 .. 9 |
Go to quick-jump target 1..9 |
Bookmarks
Bookmarks allow users to quickly jump back and forth within the analyzed binary. The idea is simple: when inside the hexadecimal, structure or disassembly view (basically anything with an address row), hit Ctrl+Alt+0 .. Ctrl+Alt+9 to set the bookmark number 1 .. 9 at:
the selected byte address, if a single byte is selected in the view
the first address displayed in the view otherwise
When a bookmark is set at a given address, its number will be displayed in the address row of the view, as you can see in the picture below. If you don’t like using your keyboard, there is also a new Toggle bookmark sub-menu in the context menu, that will set / unset a bookmark at the address that you just right-clicked.
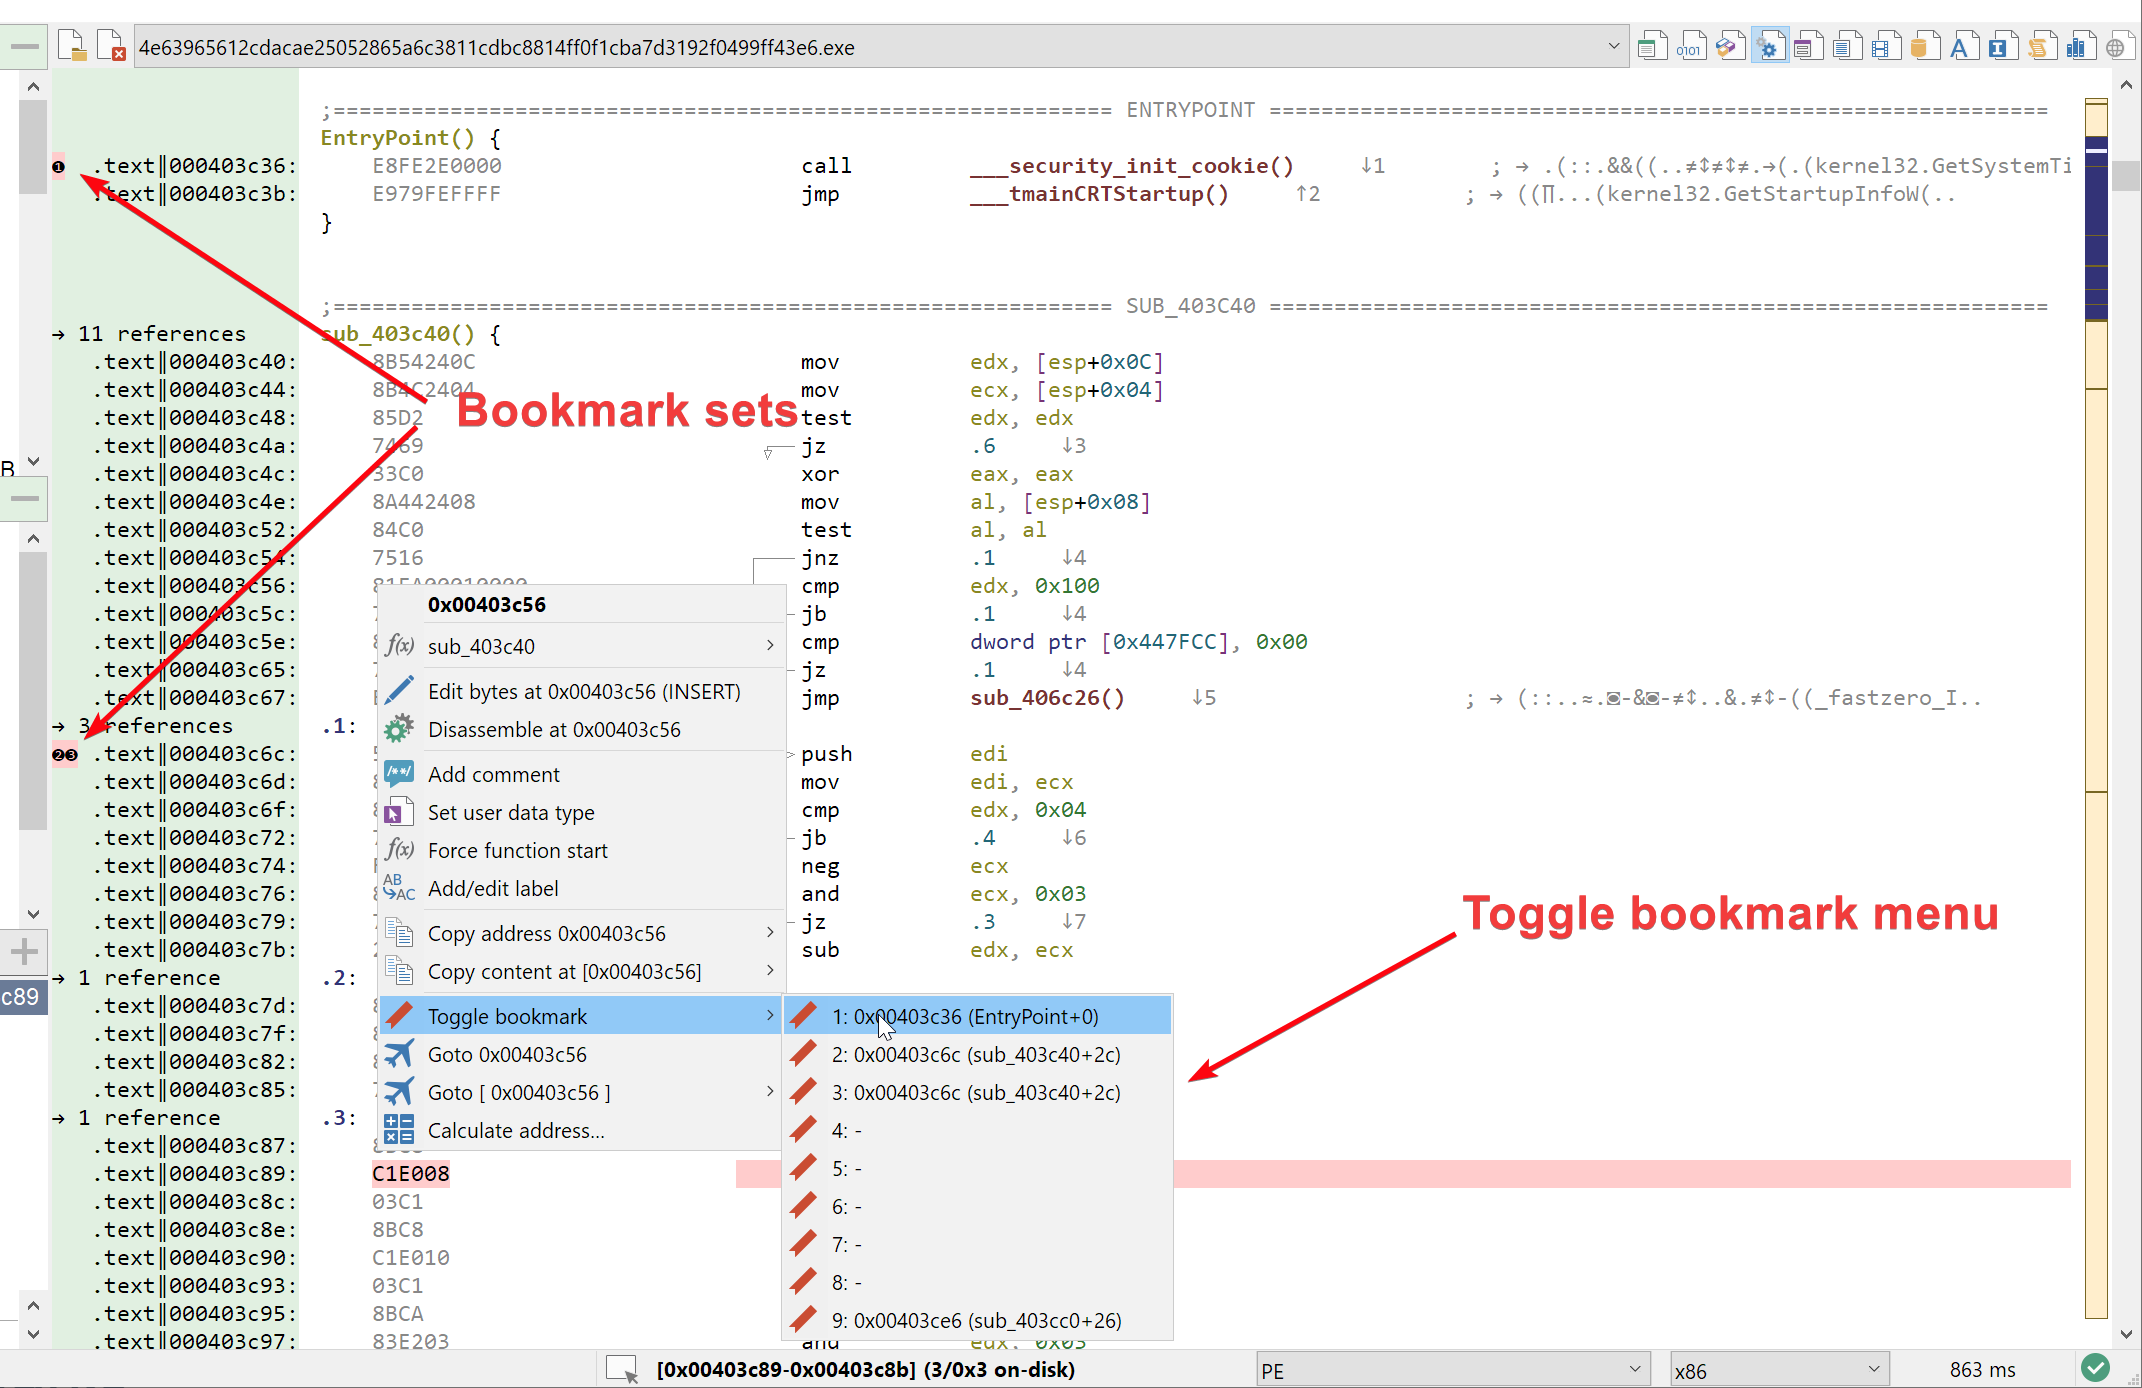
User bookmarks in disassembly view
Shortcut |
Action |
|---|---|
Ctrl+Alt+1 .. Ctrl+Alt+9 |
Set bookmark 1..9 |
Alt+1 .. Alt+9 |
Go to bookmark 1..9 |
References
Incoming references are displayed in the address bar on the left. Clicking on → 2 references opens the list of incoming references in the quickview panel. You can additionally dispay incoming references for any address or instruction by selecting an instruction in the disassembly view and chosing .
Shortcut |
Action |
|---|---|
x or X |
Goto next/previous Xref |
Highlighting
CPU instructions in Malcat are categorized into different categories (that’s true for all architectures). The disassembly view allows you to highlight a few of these categories, in order to spot interesting pattern more easily. Like for the Hexadecimal view, holding the Tab key brings the highlight dialog as you can see below:
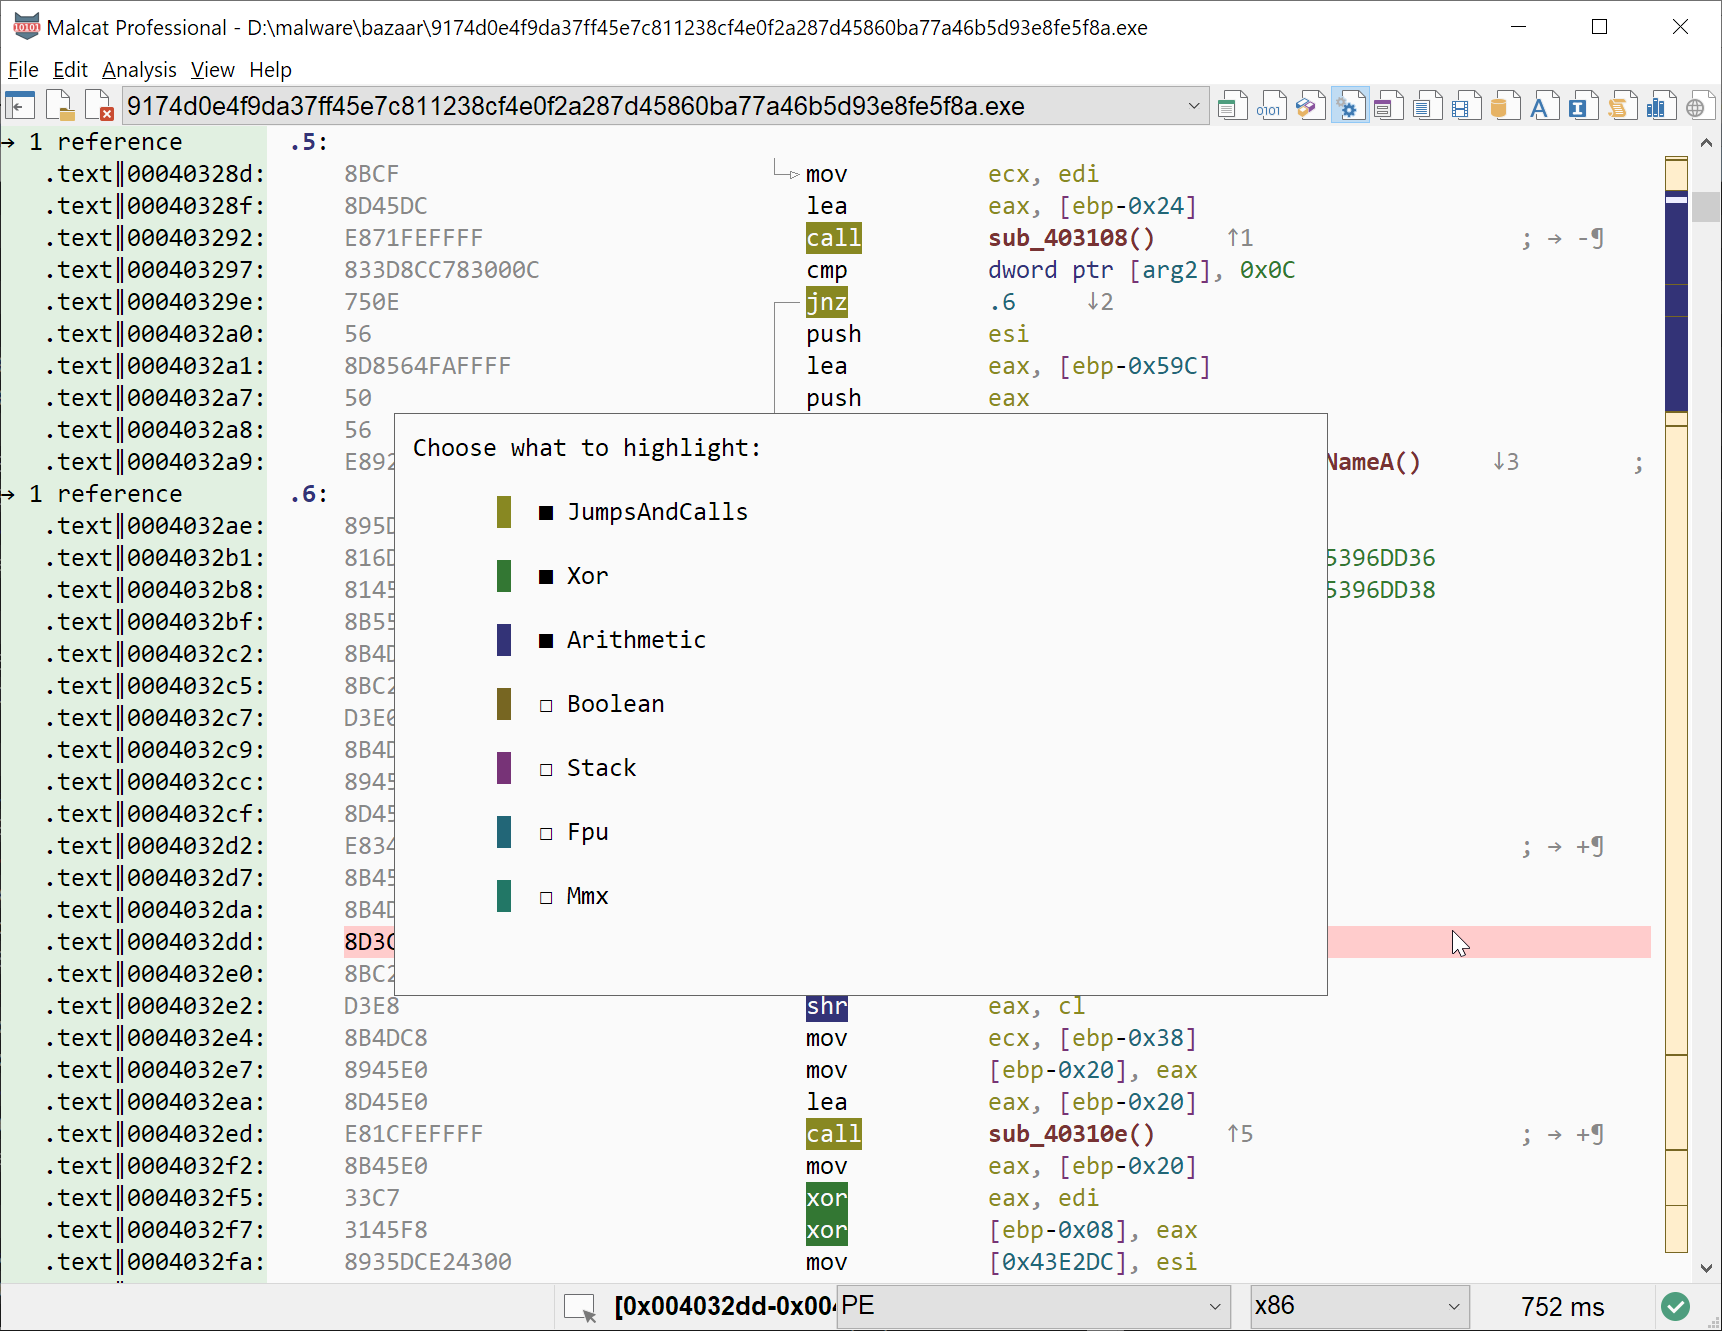
Highlighting instruction groups
Highlighted instruction groups are automatically saved when the program exits.
Shortcut |
Action |
|---|---|
Tab (keep pressed) |
Display highlighting dialog |
Shift+Tab |
Highlights/unhighlight all instruction groups |
Augmented scroll bar
Like in the Hexadecimal view, the disassembly view features an augmented scroll bar. Left of the system scrollbar, functions and data blocks are drawn using a 2 colors code. This gives you a lot of information and tells you where you are currently in the file, while using very few horizontal space.
Each identified function is drawn using a rectangle with a border. For big functions, you can easily judge their relative size (relative to the file total size) by taking the size of the rectangle into account. For small functions, the rectangle will be so small you will only see the rectangle’s border color. But then you also get the information that at this location, only small functions are present, which is also valuable.
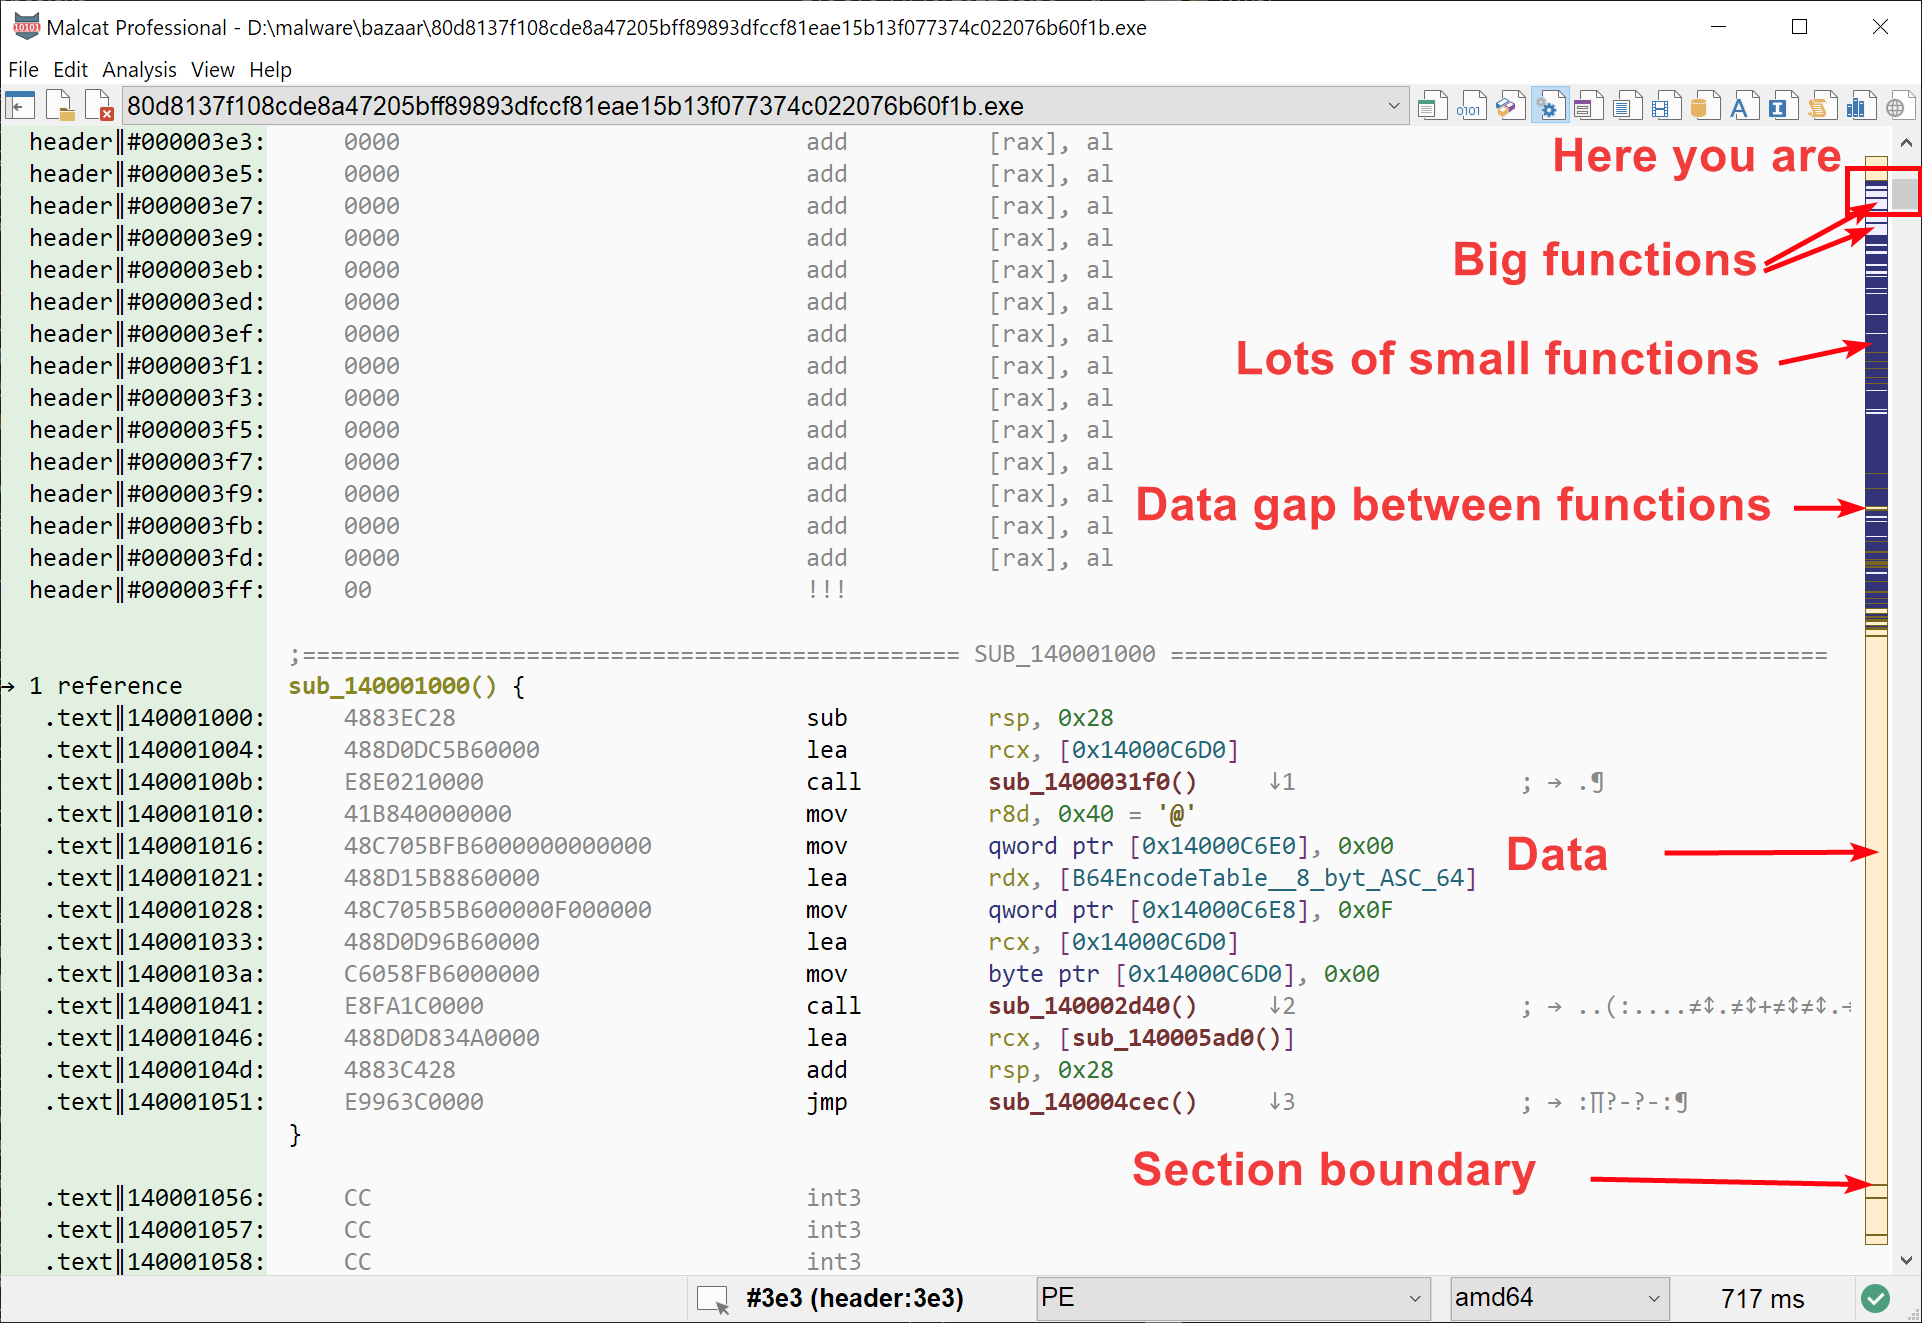
Making sense of the augmented scroll bar
The second color is used for contiguous data blocks. You may want to avoid looking at these locations, or switch to one of the data views, since no identified code is present there.
Dead code / data
Code which is unreachable is still disassembled on screen, but using a dimmed color. This should allow users to quickly identify dead code. If the analysis was wrong and the code is indeed reachable, you can define a new function, see Define a new function.
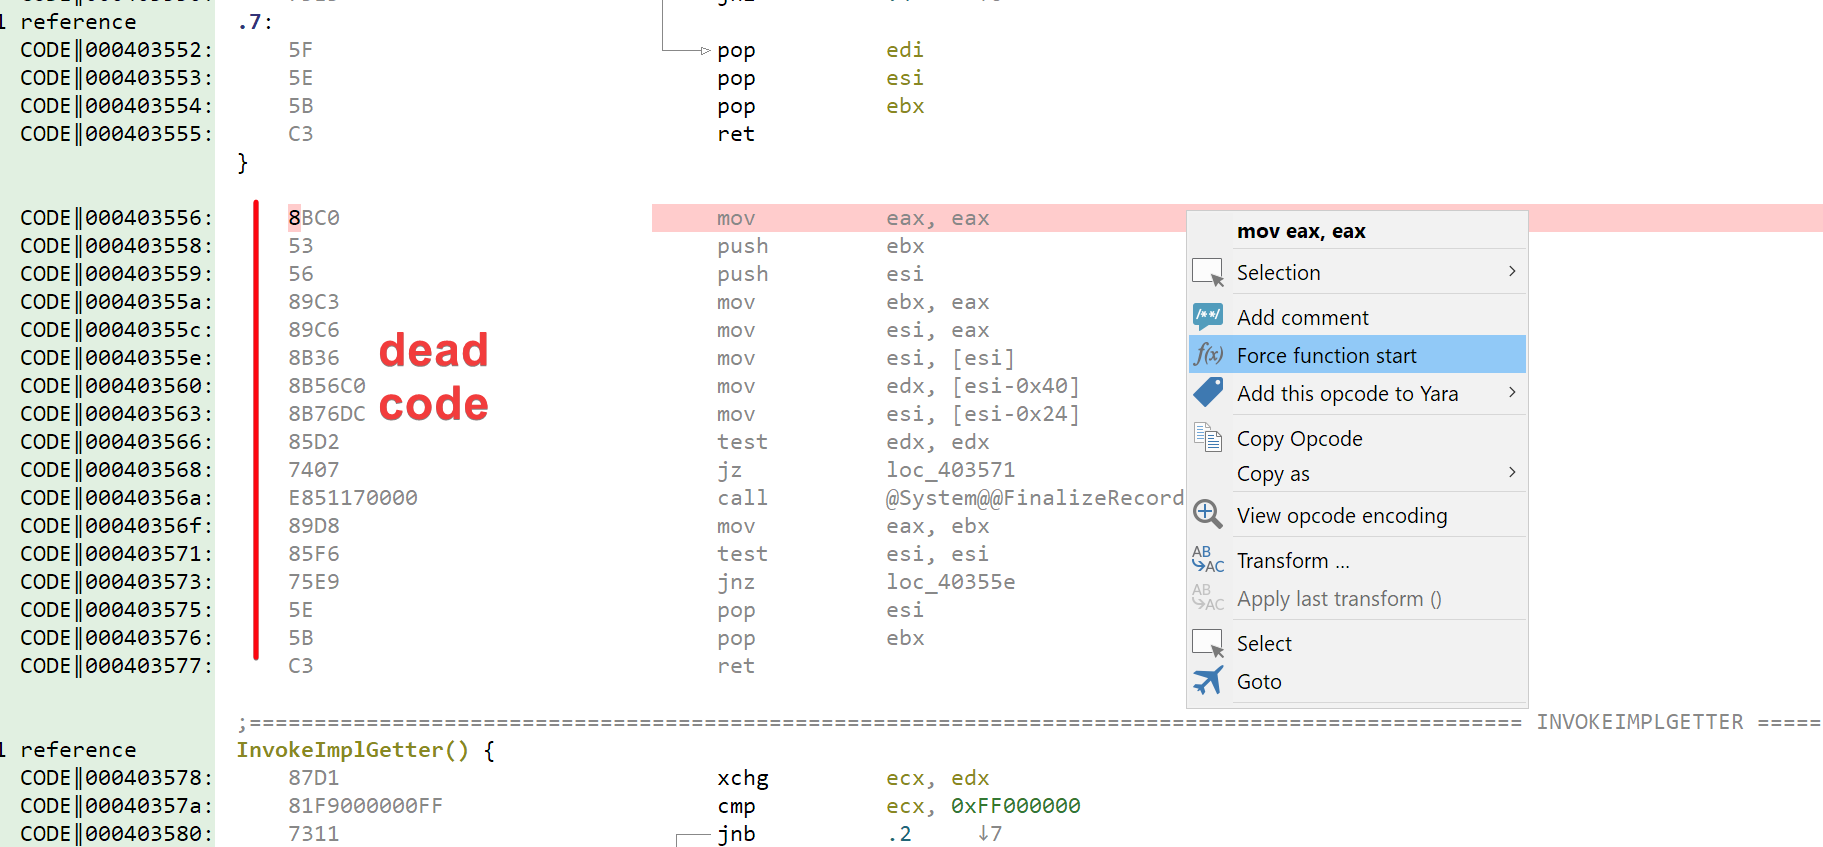
dead code beeing displayed in grey
Note that dead code is disassembled using a different algorithm than normal code. Normal code instruction are aligned along the start of their enclosing basic block. Dead code is not aligned at all, and an heuristic is used to approximate the start of the previous instruction. For some architectures like x86, this may produce sub-optimal disassembly when naviguating backward.
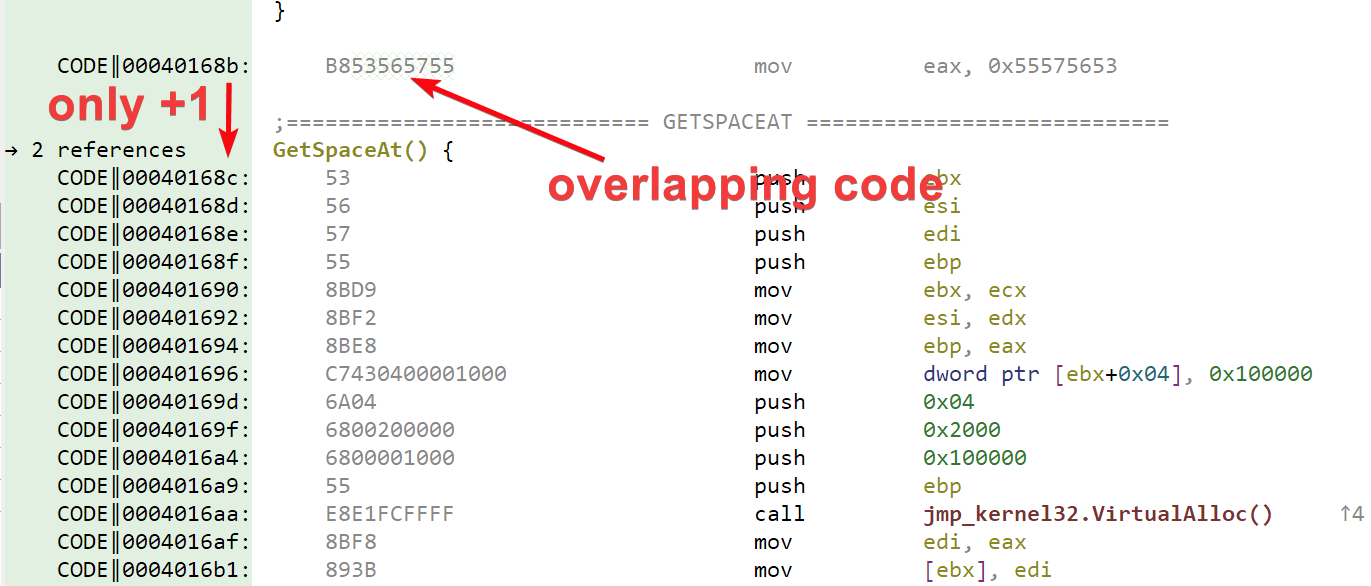
Opcode overlapping
normal labels (left) versus smart local labels (right) in disassembly listing
Local labels
Labels which are only referenced by jumps from within the current function are called local labels and are named .1, .2 … .N instead of the usual loc_XXXXX. We find this make the disassembly more readable (in particular if you are familiar with nasm syntax) and also gives extra information to the user, i.e is the label referenced from outside the current function?
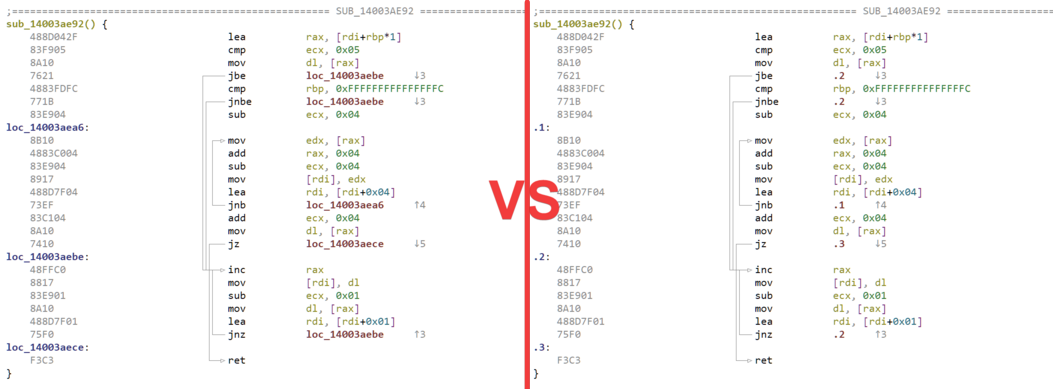
normal labels (left) versus smart local labels (right) in disassembly listing
Smart label naming scheme can be turned on or off in the options dialog: .
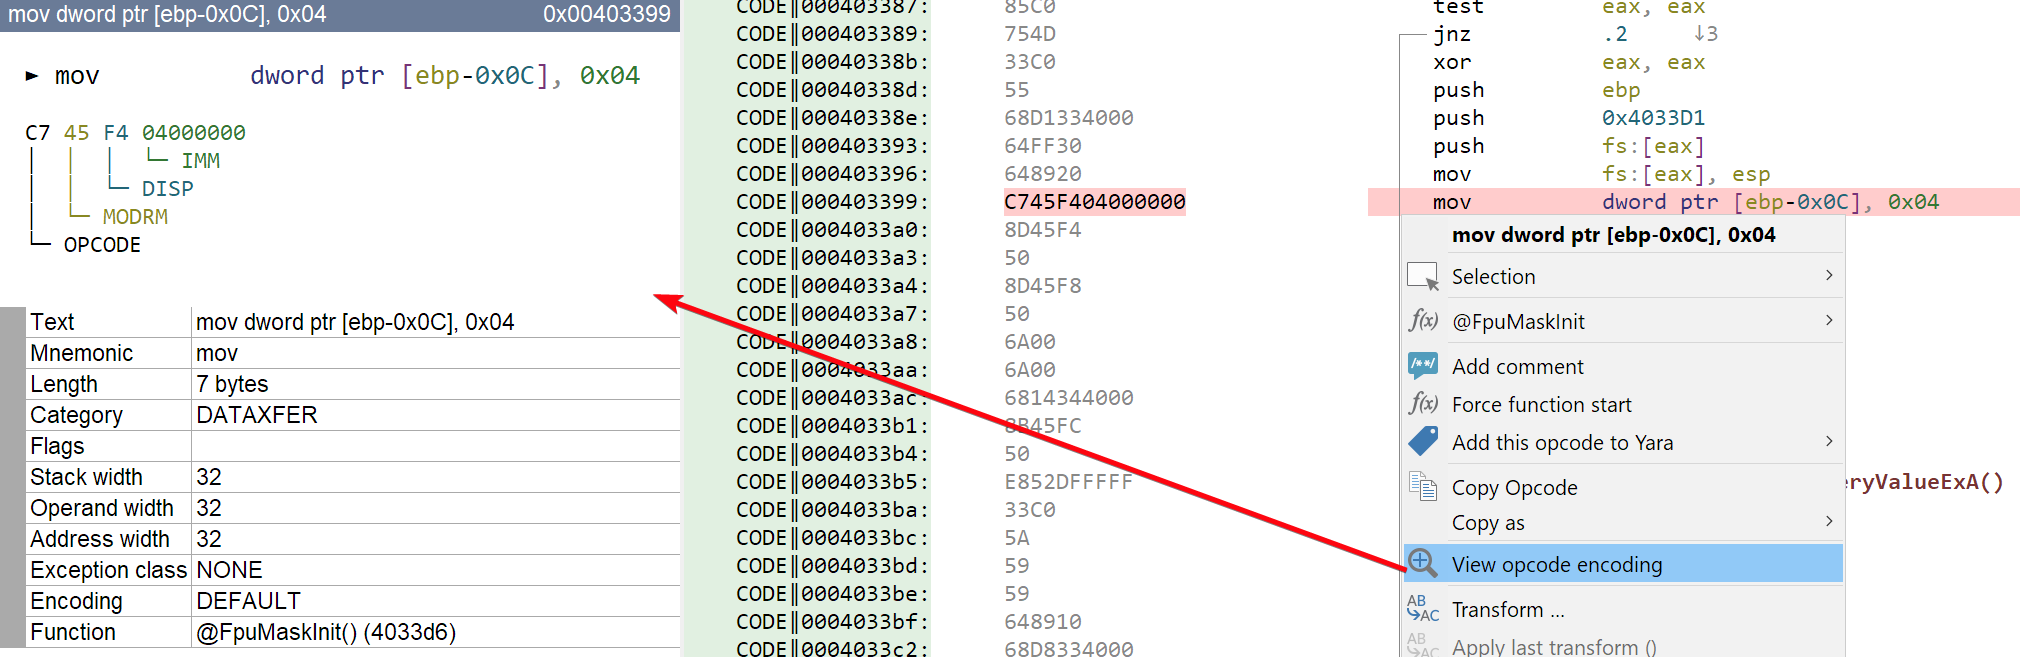
Opcode encoding
By clicking on any opcode, you’ll also get a detailed view of the selected instruction, showing instruction metadata and encoding details.
normal labels (left) versus smart local labels (right) in disassembly listing
Autocomments
Sometimes, wou will see that Malcat adds automatically some comments alongside some of the instructions. These auto-comments are only visible if no user comment have been defined at this location (cf. Add a comment). Currently two types of auto-comments are added:
Call auto-comments: the DNA representation of the called function is displayed (cf. DNA view). This allows you to have a peek of the function’s prolog without having to put the mouse pointer over the call target
Dynamic strings: if a stack-string has been identified by Malcat’s Dynamic strings analysis, two auto-comments will be displayed: one at the first instruction responsible for the string’s initialisation, and one on the last instruction.
Note that more auto-comments types may be added in the future.
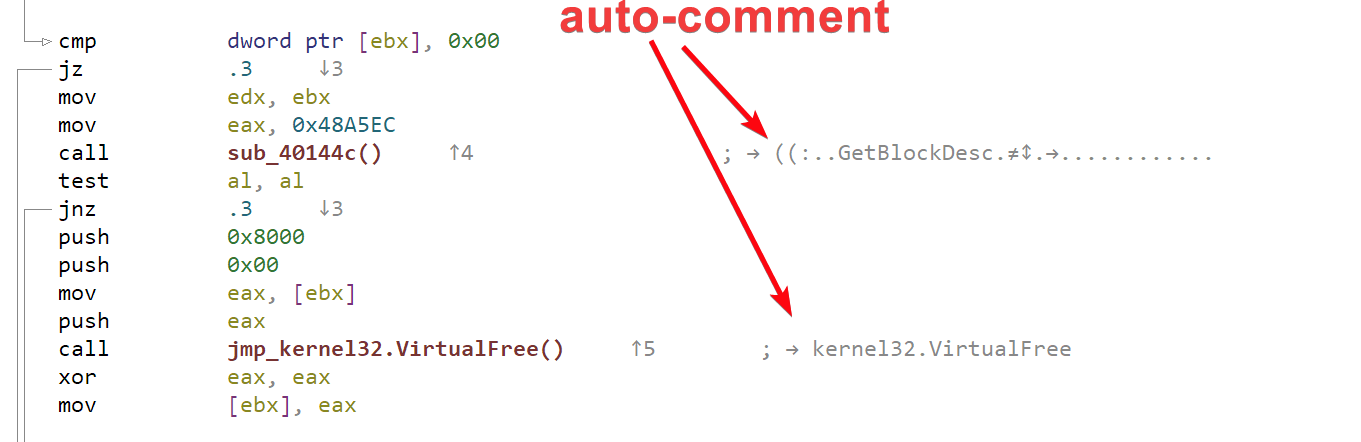
auto-comment on function call
Editing
Define a new function
If you think that Malcat’s CFG / functions recovery algorithm was wrong and that some data is actually a piece of code, you have the possibility to create a new function: . Malcat will then define a new function at this location and perform a new pass of CFG / functions recovery.
normal labels (left) versus smart local labels (right) in disassembly listing
User-defined functions are saved within Malcat project file.
Add a comment
Using the context menu on an address or an assembly instruction, you can add user-defined comments. Comments can be multi-line and are saved within Malcat project file.
Shortcut |
Action |
|---|---|
m or M |
Goto next/previous user coMment |
Modify bytes
You can modify the bytes displayed in the disassembly view in the same way you would edit any byte in the hexadecimal view (cf. Editing bytes). Just double-click on a byte in the hexadecimal column or use the context menu . You will enter edit mode.
When you modify bytes, the disassembly listing is updated as you type. This allow you to quickly patch an instruction. Note that while the disassembly is updated, the analysis of the program (e.g. CFG / functions recovery) is not updated. Hit Ctrl+R or use the menu when you are done to reanalyse the file.
Shortcut |
Action |
|---|---|
Insert |
Enter/leave edit mode |
Double-click |
Enter edit mode |
Esc |
Leave edit mode |
Selecting and advanced operations
Selecting instructions
In addition to selecting opcode bytes in the hexadecimal columns (like you would do in the Hexadecimal view, see Selecting), you can directly select opcodes from within the disassembly view using the mouse. Just click on an opcode and move your mouse. You can also click on the first opcode you want to select and then Shift+Click on the last opcode you want to select.
Opcodes selection and copy to the clipboard
Selecting bytes in the hexadecimal column will select the corresponding opcodes and vice-versa. Also note that the selection is synchronized across all views. For more information regarding selection, see Working with the selection.
Shortcut |
Action |
|---|---|
LeftClick (keep pressed) |
Mouse select |
LeftClick |
Select byte/nibble and set start of selection |
Shift+LeftClick |
Set end of selection |
Ctrl+LeftClick |
Exclude byte/nibble and set start of exclusion pattern |
Shift+Ctrl+LeftClick |
Set end of exclusion pattern |
Ctrl+A |
Select everything |
Copy to the clipboard
If you want to export a subset of the disassembly listing (up to 10000 instructions), you can select the instructions you want to copy followed by the shortcut Ctrl+C or the context menu (see above).
The selected disassembly listing will be put into the clipboard with the exact same layout as you can see in the disassembly view. Note that both a text version and an html version are put into the clipboard. Also note that the raw bytes will also be saved into the clipboard using the alternative mimetype application/octet-stream. This way, you can paste the data into another view (or another compatible software).
Shortcut |
Action |
|---|---|
Ctrl+C |
Copy disassembly listing to the clipboard |
Add opcodes to a Yara rule
When carefully chosen, a small machine code snippet can go a long way in improving the quality of a Yara rule. Select the instructions you want in the disassembly view and from the context menu chose: .
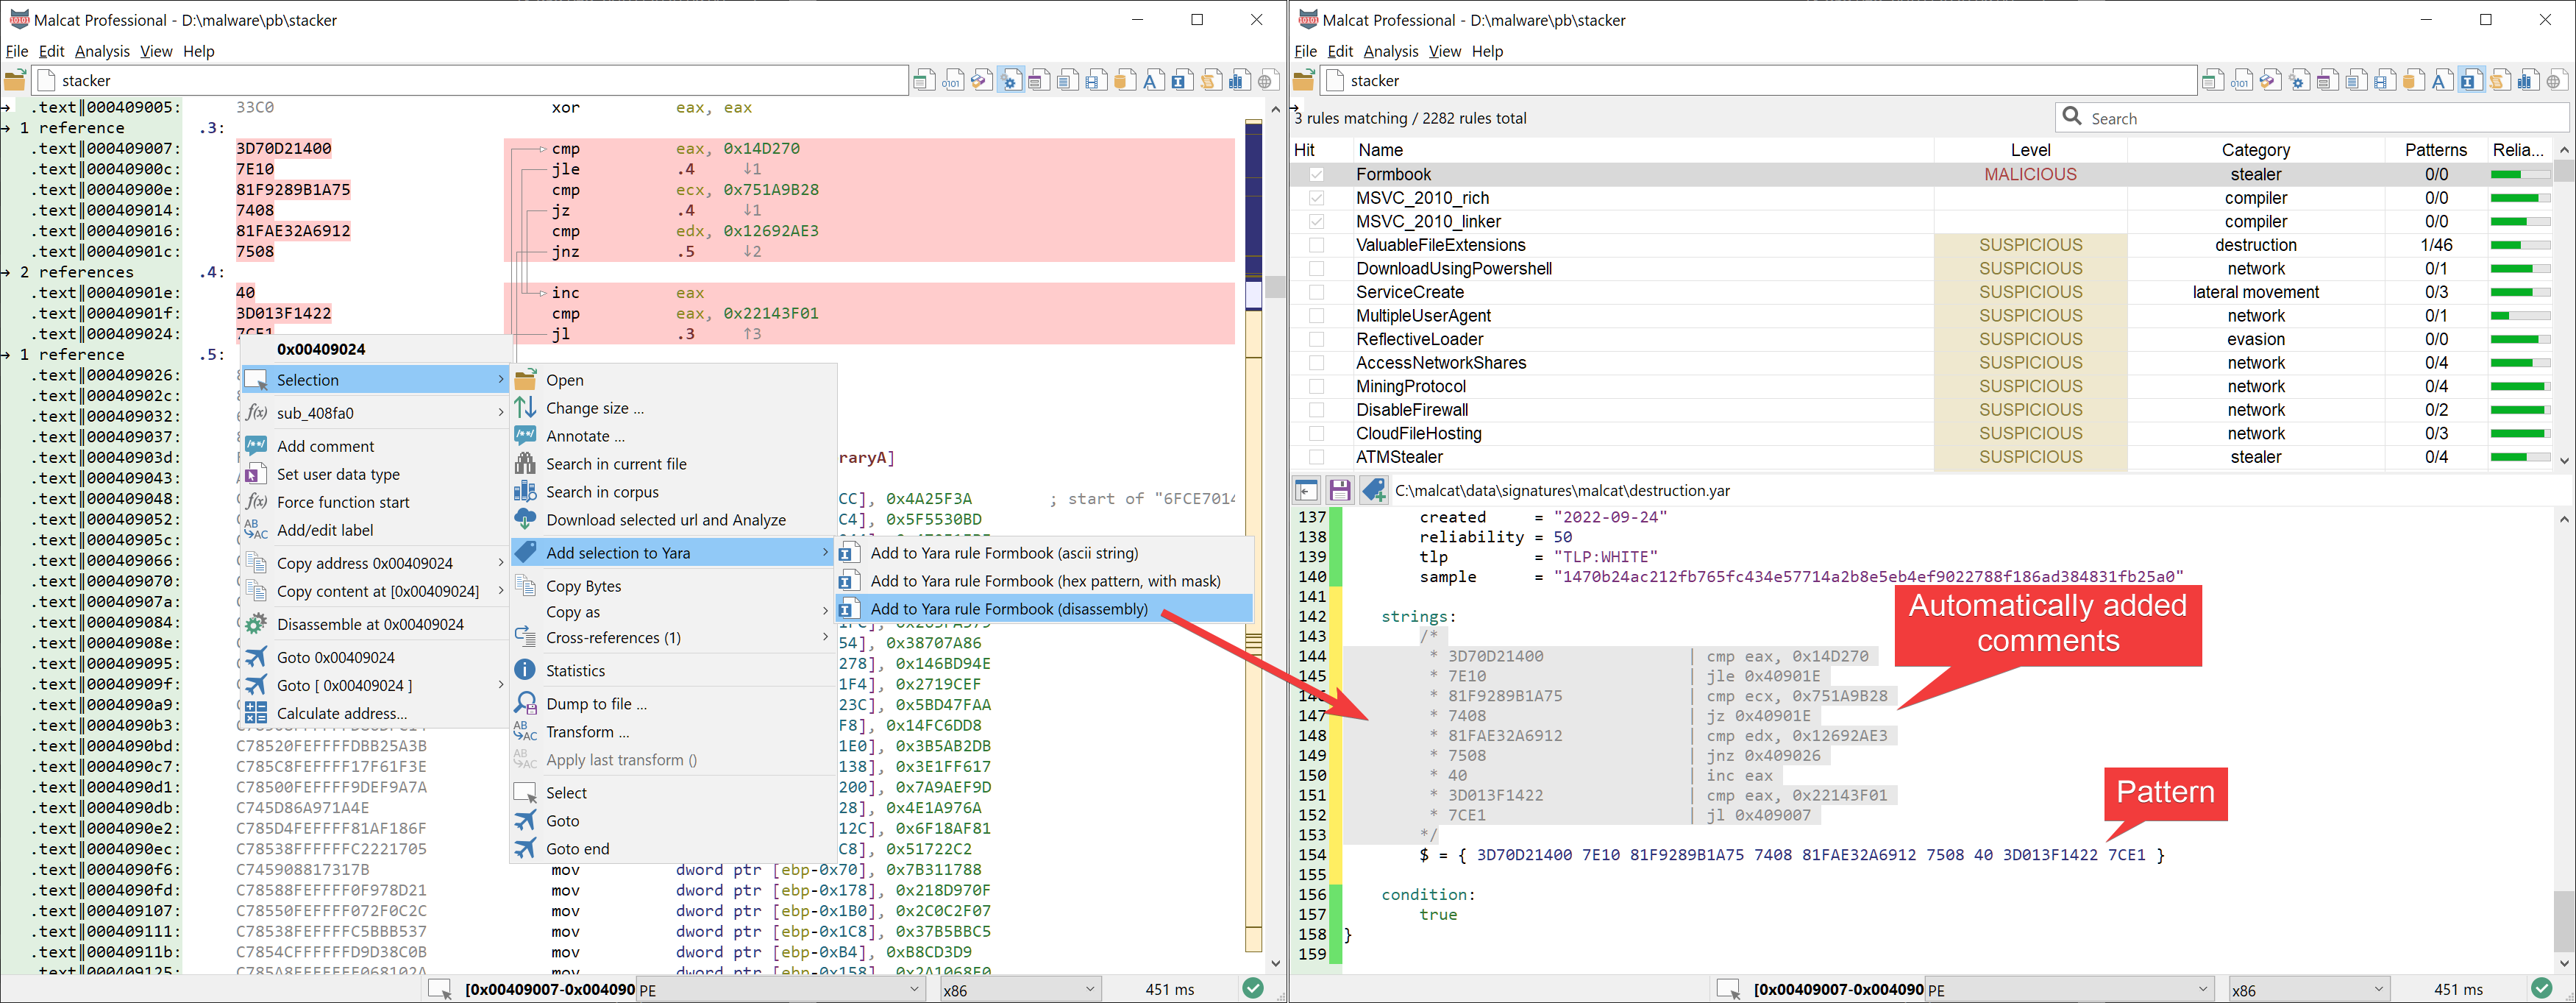
Adding disassembly listing to a Yara rule
The selected bytes will be added to the current Yara rule as an hexadecimal pattern. The pattern will be prefixed by a large comment showing the actual machine-code representation of these bytes, which should greatly improve the rule’s maintainability.