Function call graph
The call graph window is accessed either from a function’s context menu () or from the Proximity view’s toolbar button. It displays the caller / callee relationships between all the identified functions of the program, centered around the current function.
Basics
The call graph window needs you to be located within an identified function. If you are outside the scope of a function, you’ll first need to jump to one, either by hitting f or F, or by clicking on any of the identified function in the Functions tab left of the window.
Zooming out can provide you with some insight: this functions looks obfuscated
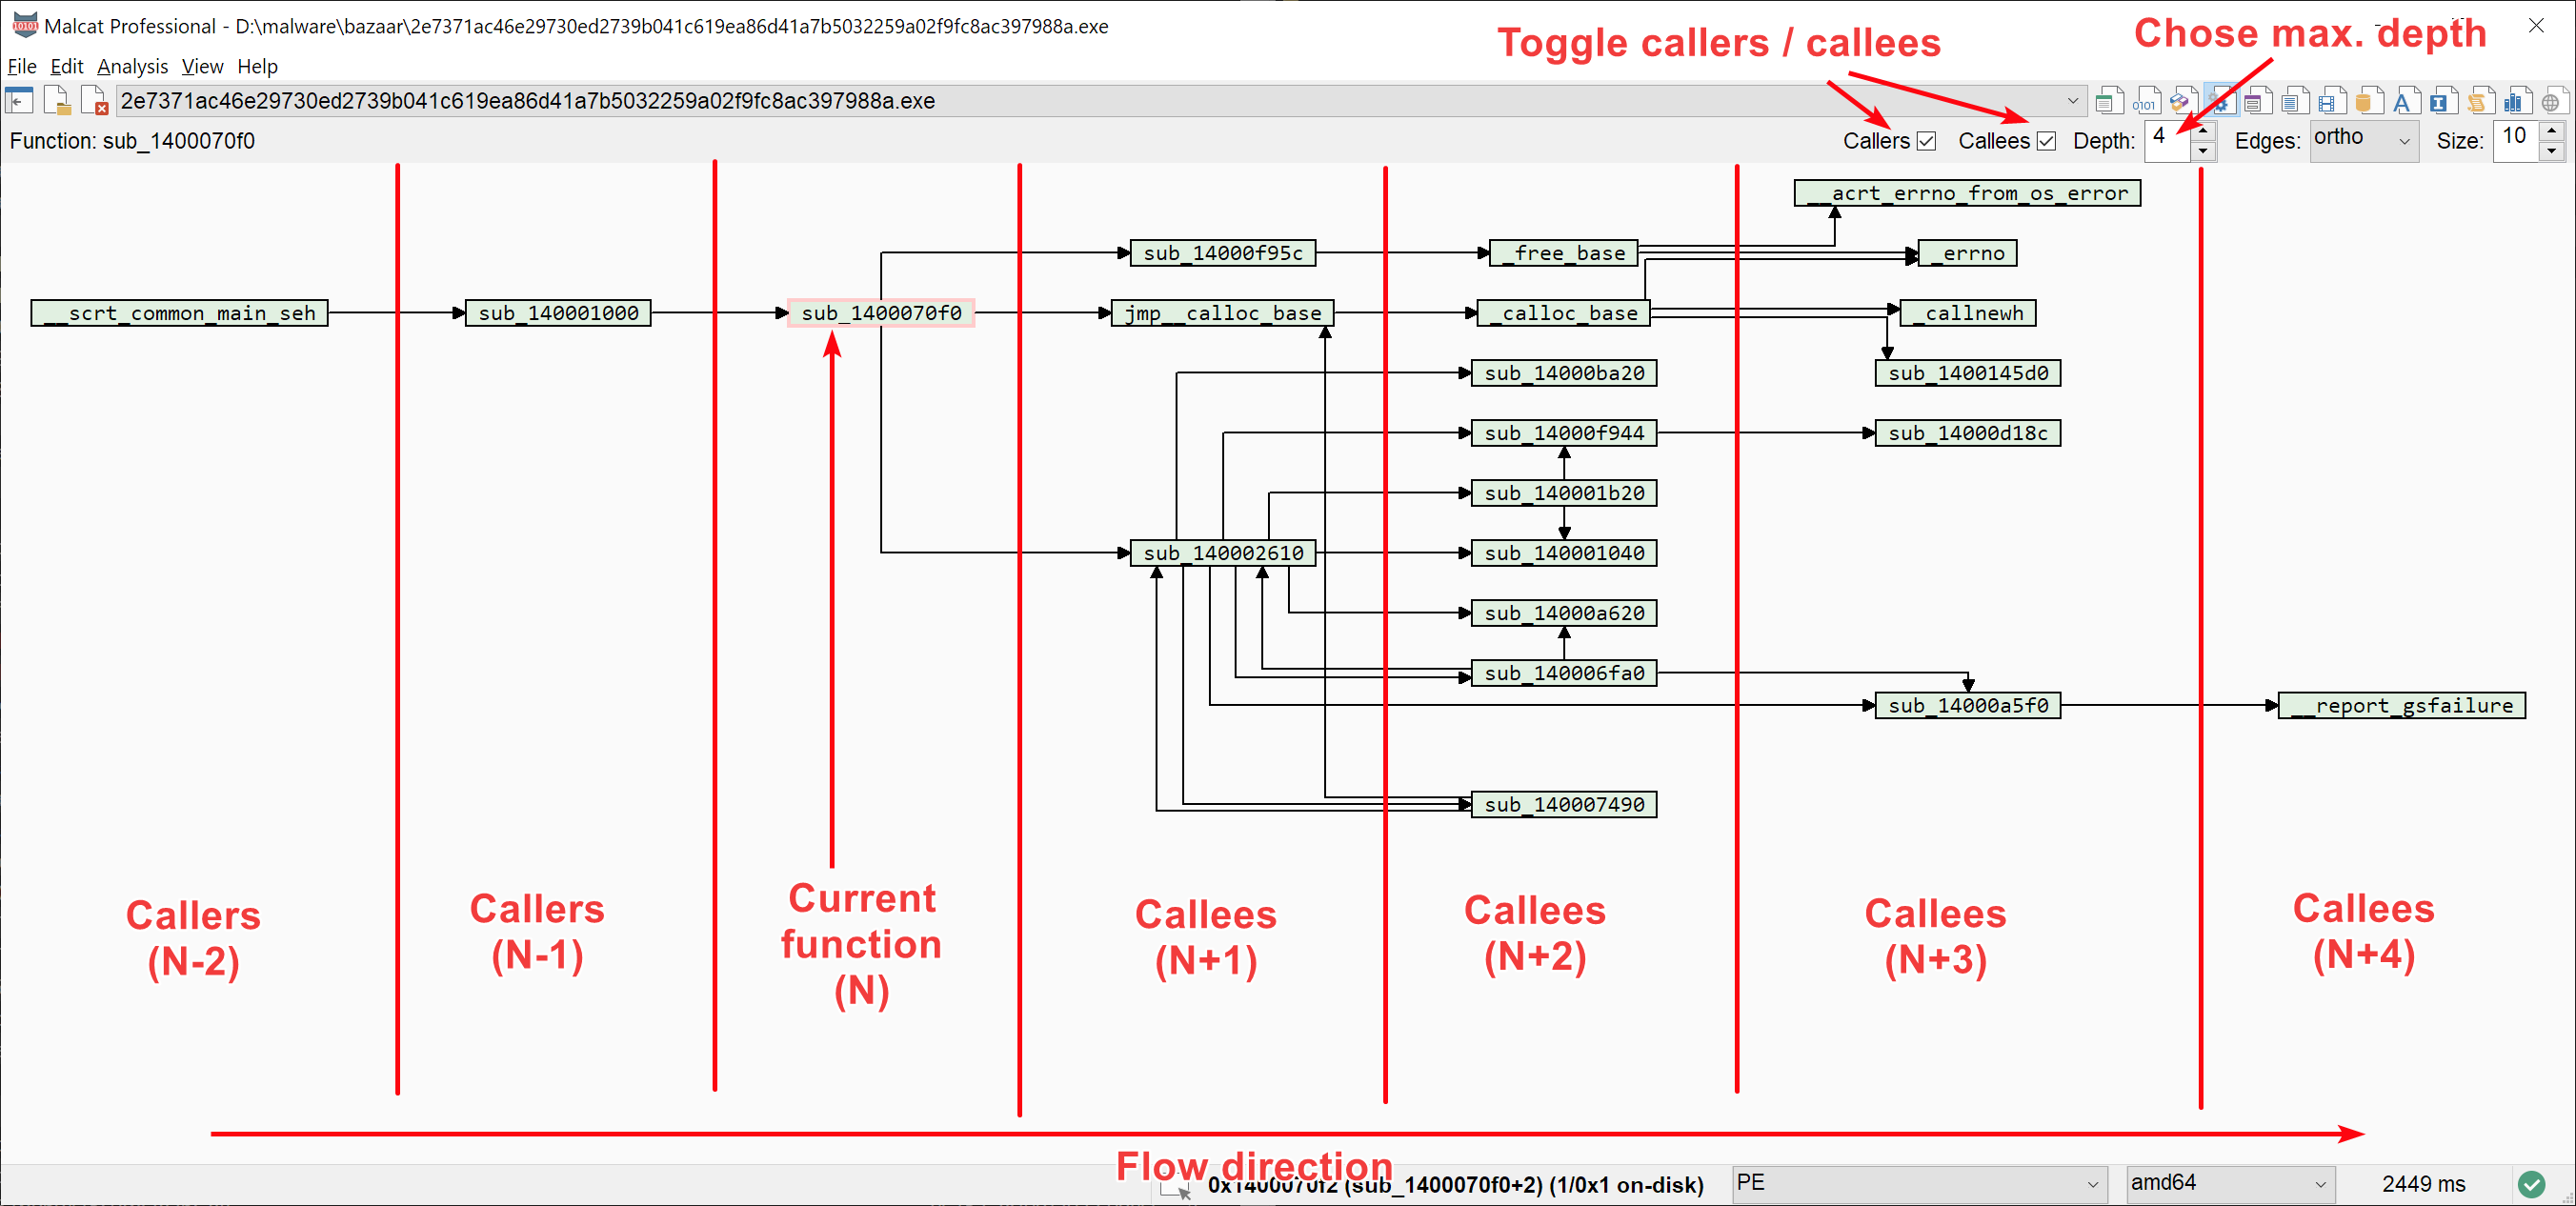
The call graph window then displays the graph of functions and their caller/callee relationships, centered around the current function. The relationships are displayed up to a fixed depth, which can be set in the toolbar.
In this graph, each function is represented by a node. Clicking on a node will display the node in a code view (either the Disassembly view or the Proximity view, depending on which on was used last). The graph layout is horizontal:
the left-most nodes are the callers
in the middle is the current function (highlighted with a red border)
the right-most nodes are the callees