Threat intelligence report
The threat intelligence report is accessed using the F10 shortcut. It displays the scan results of several online Threat intelligence providers services for the current file. Threat intelligence queries are performed on demand, either from the Summary view or using the shortcut Ctrl+I.
Note
At no point in time get your file uploaded to any of these services. Only hash queries are performed.
Threat intelligence services
Lookup scripts
Querying multiple online threat intelligence services can become a chore. Malcat automates part of this process by sending the current file’s hash to multiple lookup services concurrently, from within the user interface. This is done in python: multiple scripts (one per service) are located in data/intelligence/. We regularly add new services, so feel free to Contact us if your favorite service is missing. We currently have support for:
Each script is responsible for querying the lookup service and organizing the result. They are all asynchronous by nature, allowing for all queries to run in parallel.
Configure the threat intelligence services
With Malware Bazaar being the exception, all threat intelligence services require either an API key or credentials to work. Luckily, you can create free (limited) accounts for all the services we support, so there is nothing forbidding you to activate all of them.
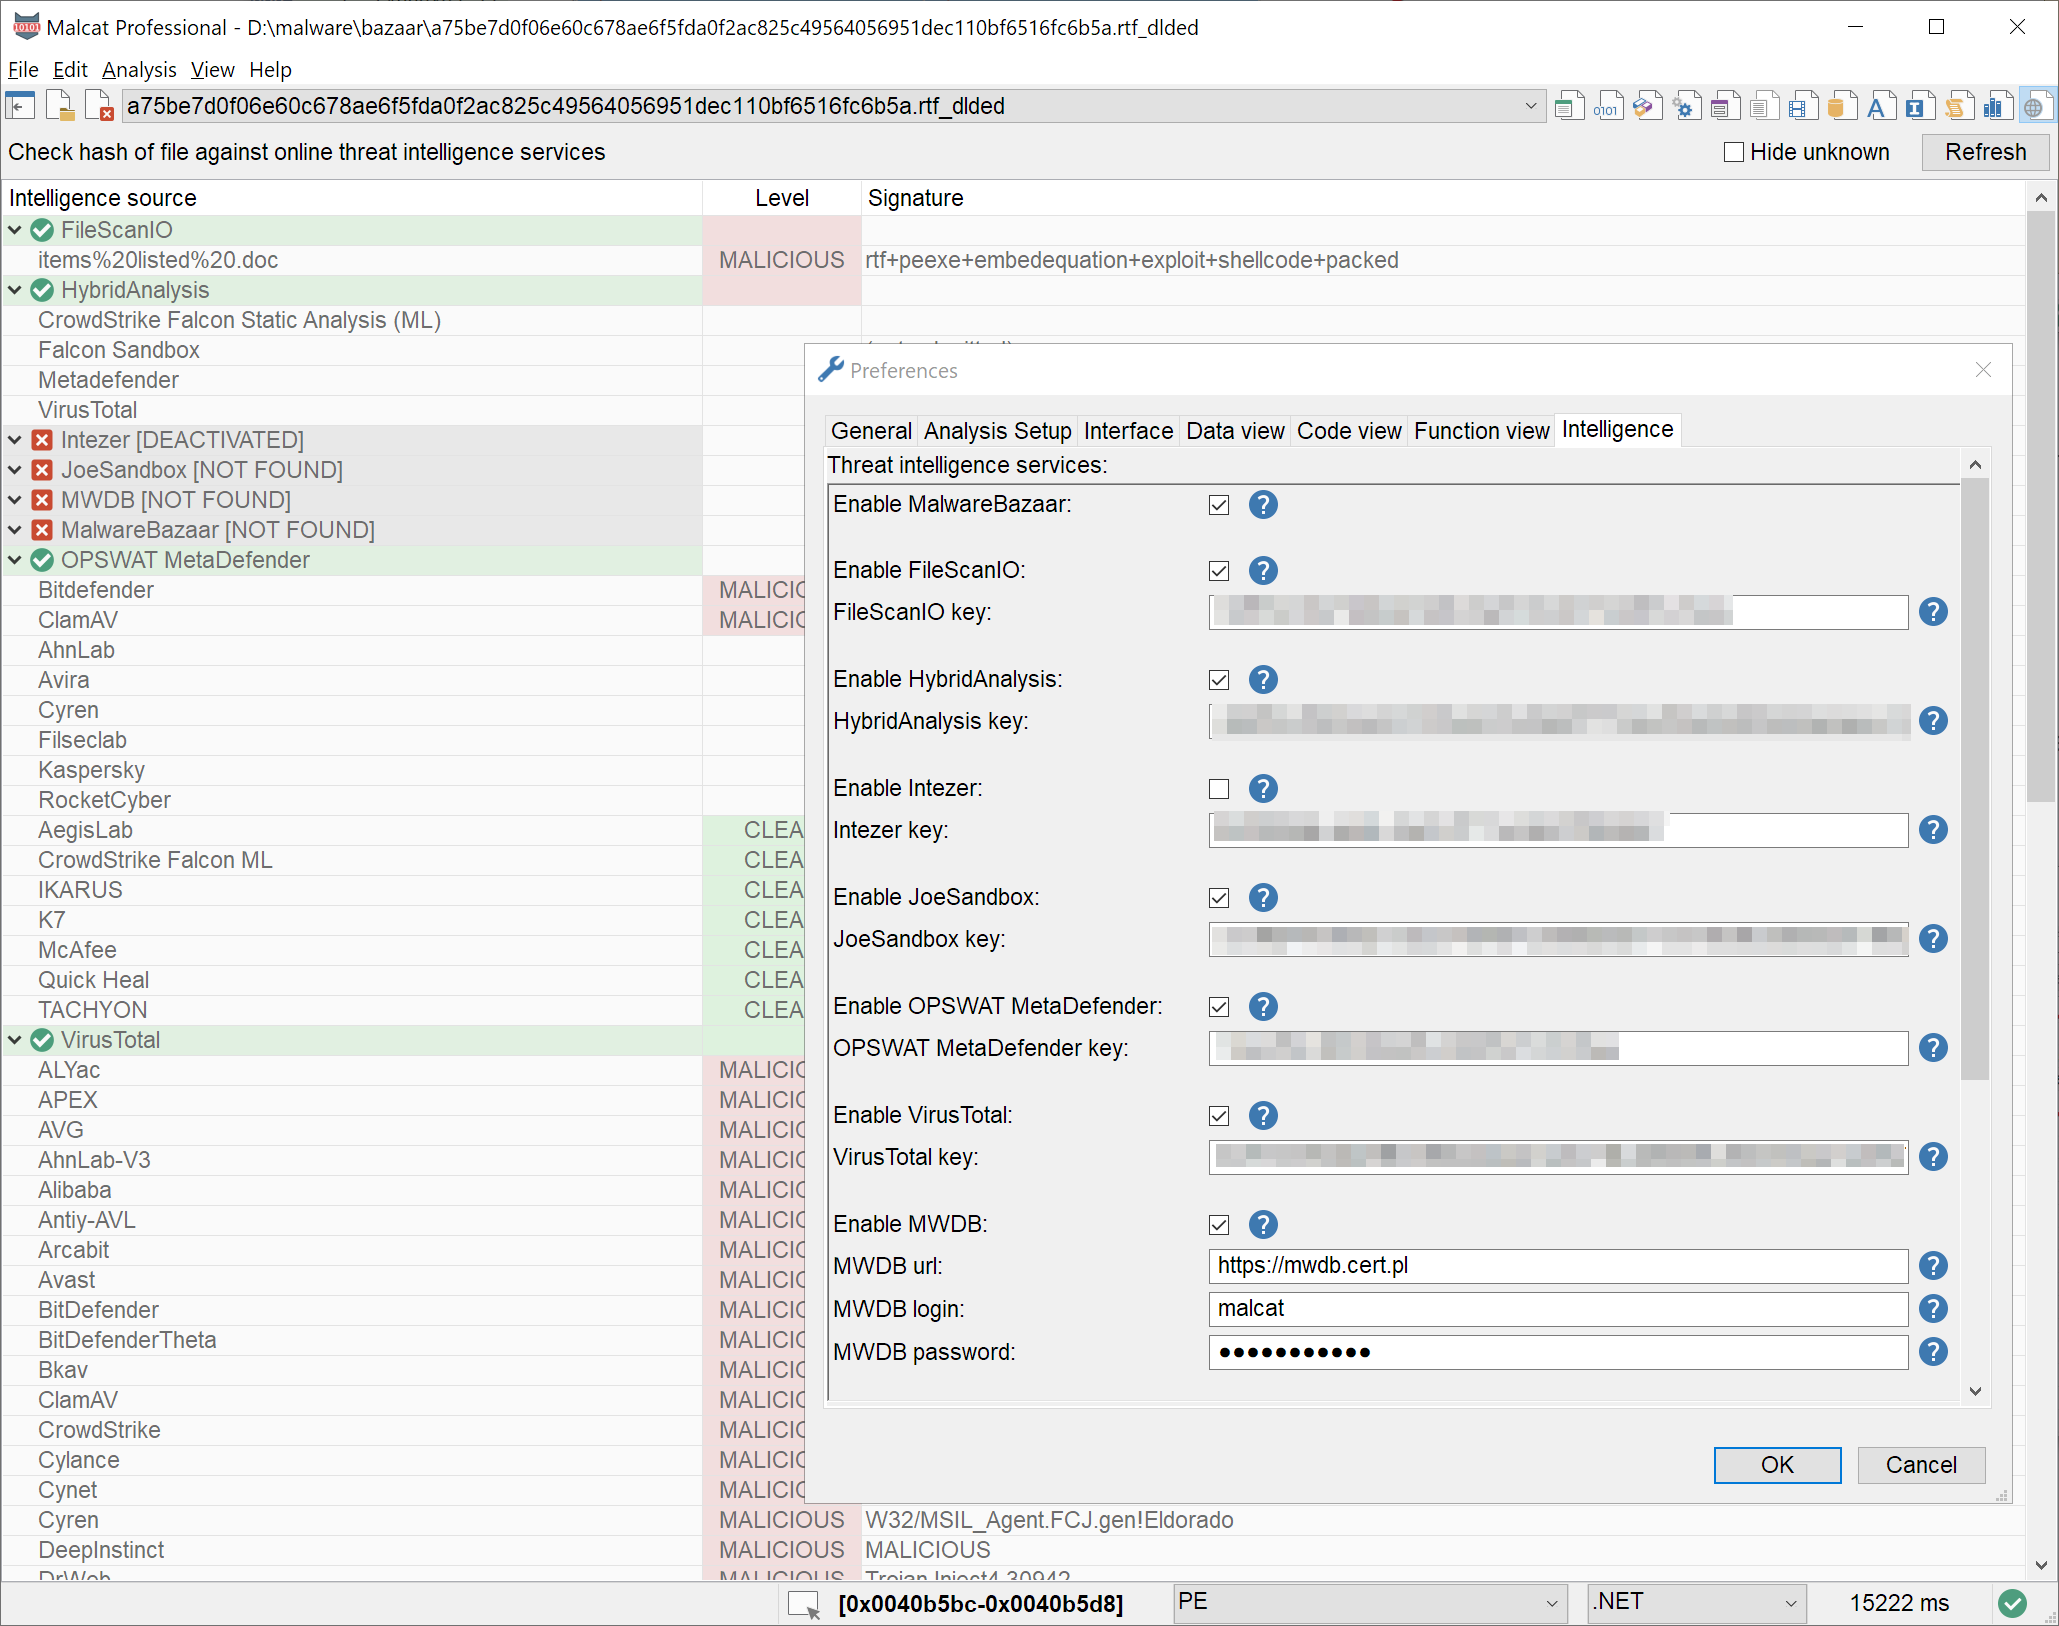
Configuring threat intelligence lookup services
Once you have registered to these services and got your credentials, you can enter all information in . There you can also chose to activate or not specific providers. Once you are done, click OK and hit Refresh or Ctrl+I and get to the results.
Displaying results
Threat intelligence queries in Malcat are performed on demand. You can initiate one either from the Summary view (using the Check online intelligence button) or using the shortcut Ctrl+I from any view. Once the queries have finished (you can monitor the progress through the statusbar’s gauge control), Malcat will automatically open the intelligence view.
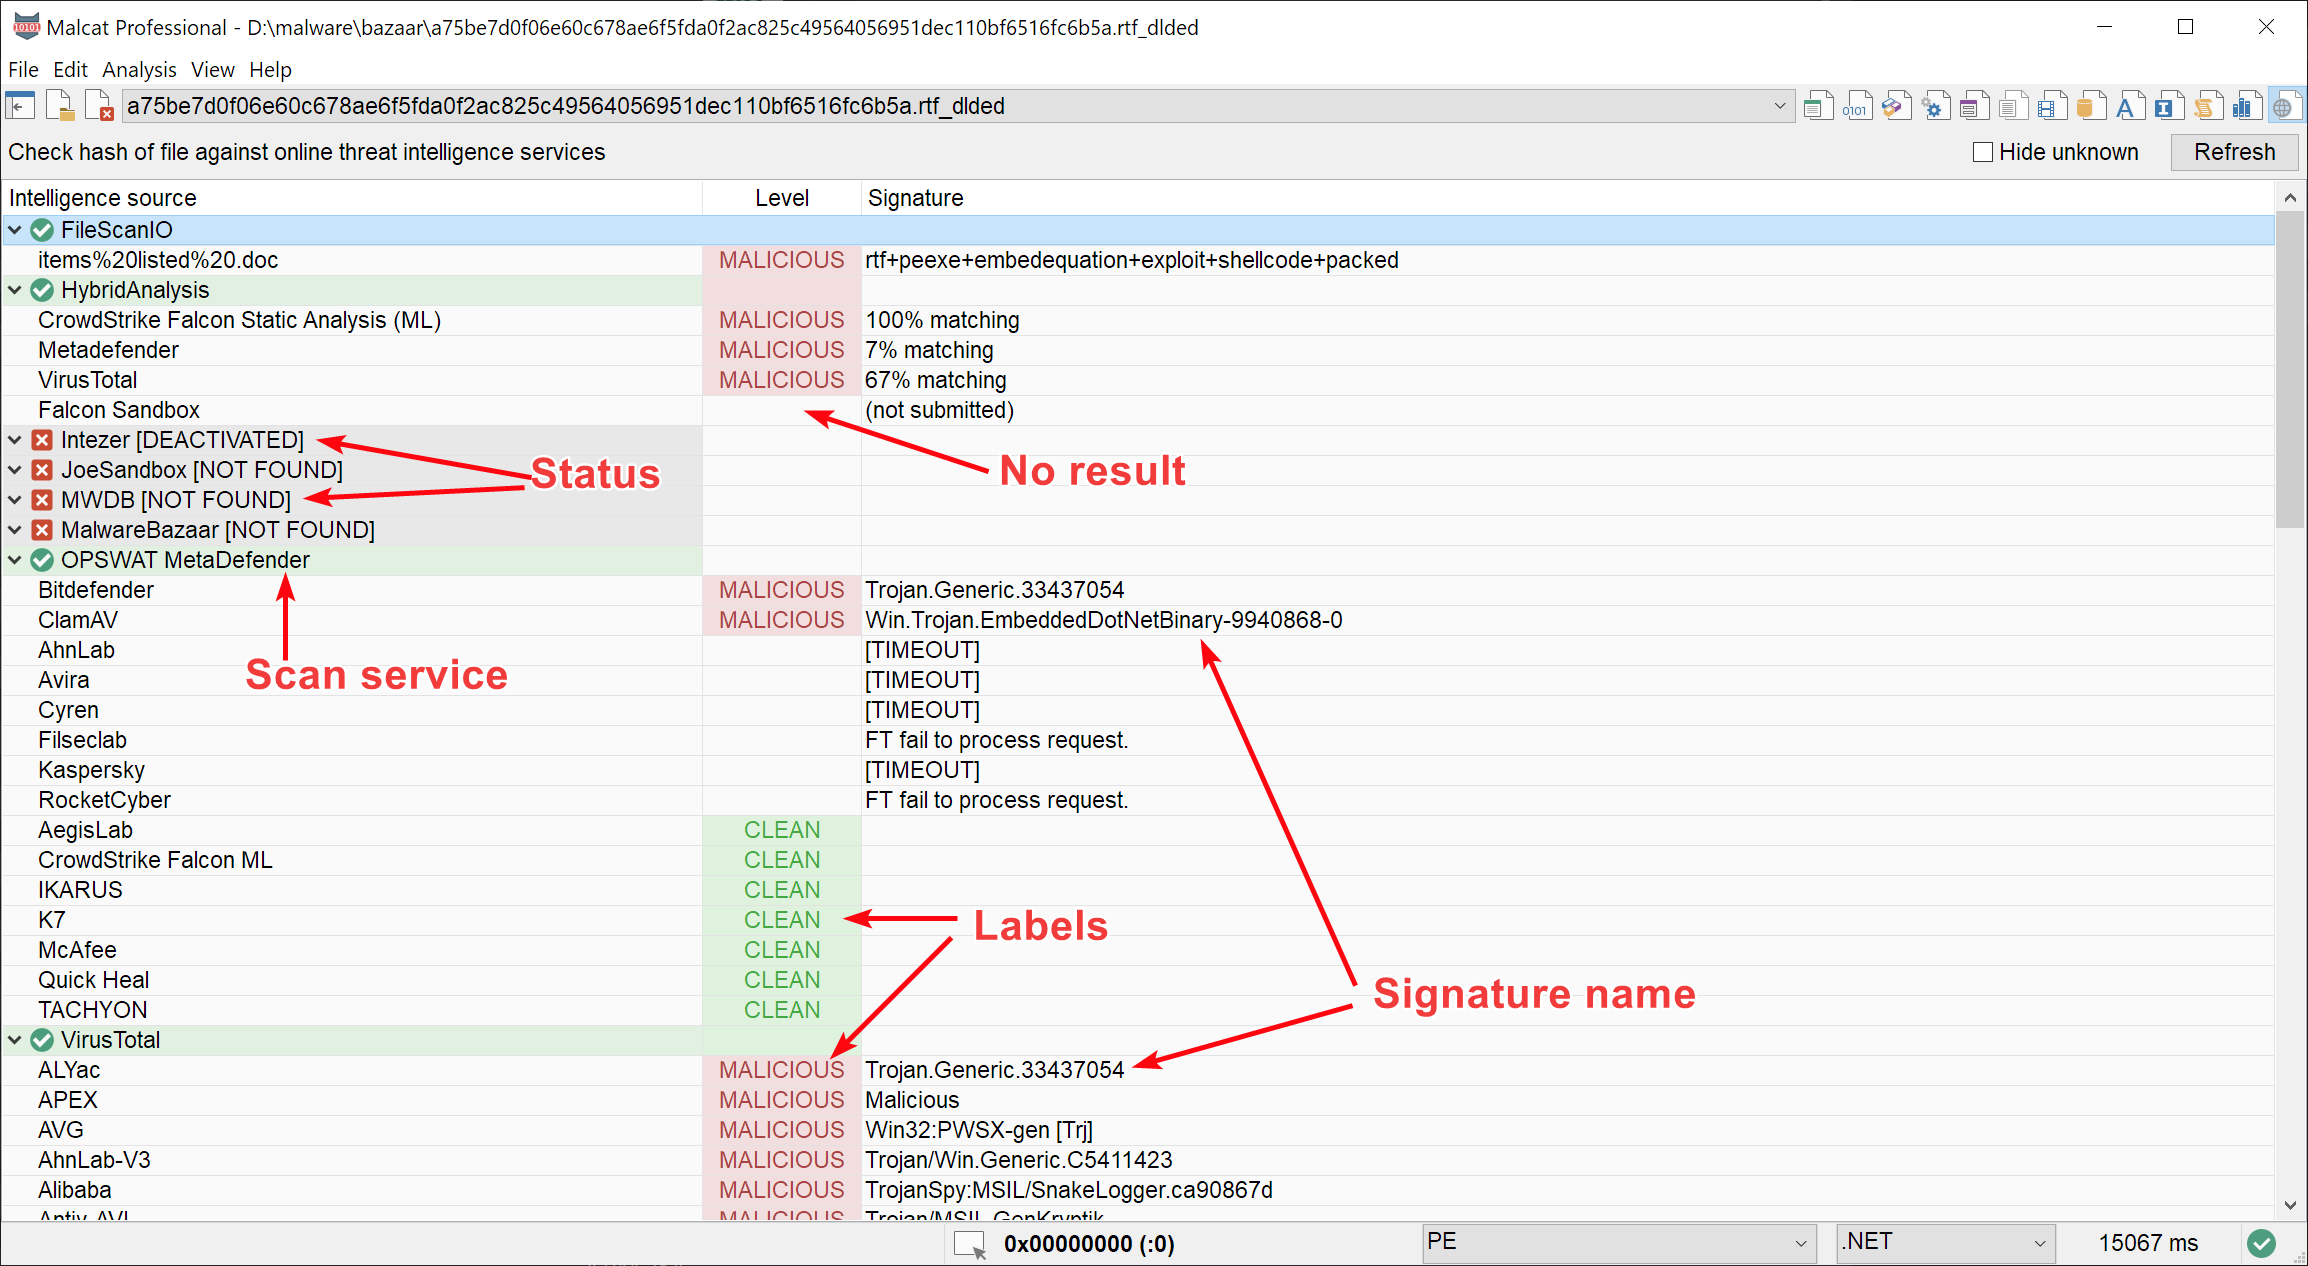
Displaying hash lookup results
You will be presented with the result grid above. Each lookup service is represented within a collapsible tree node. The color code of the tree node has a meaning:
green means that the request was successful
gray means that the hash was not found or that the service was deactivated
red means that there was an error
Results of the lookup service are presented as children of the service’s node, in three columns. For multi-av lookup service, you will find one child per antivirus. For other services like sandbox, you’ll get one line per hit / user submission if the service allows it. Each row is composed of three elements:
in the first column, you’ll find the entry’s name: the antivirus name for multi-scan service or the submission name for sandboxes
in the second column, you’ll find the detection category: malicious, suspicious, clean or nothing if no detection at all.
the content of the third column depends on the lookup service: it can be the signature name, tags, potential errors … basically anything relevant
Note
We tried our best to map all results from these TI services to standard detection categories. For some of them (like ML classifiers giving back ony a score), keep in mind that the detection category can be different than what the vendor attended.
To get further information, you can double-click any child row in the user interface. A new browser tab will open and you will be taken to the vendor’s analysis result for the queried hash.