DNA view
The DNA view is accessed using the F4 shortcut twice. It is an original take on code visualisation and display a compact view of all identified functions using a unique one symbol per instruction paradigm. Each instruction is indeed represented by a colored symbol, which give clues about the class of the instruction and its parameters. While it may require some time in order to learn the symbols and get accustomed to the color code, we believe it is a good visualisation method if you do malware analysis:
you can quickly locate interesting code patterns inside a large code base, like crypto loops or polymorphic code
you have a compact overview of all the API calls: let’s directly jump to these VirtualProtect calls
you can easily spot weird instruction patterns or differences in opcode distribution, which is great if you deal with backdoored cleanware for instance
Note
The DNA view is disabled by default and needs to be explicitely activated in the options: Edit –> Preferences –> Interface –> Enable DNA view
Navigation
The DNA view displays machine-code instructions grouped by function. It means it can only display code located inside an identified function, unlike the Disassembly view. Since a given instruction only take 1 character, the view is pretty compact and allow you to quickly scroll through the code base.
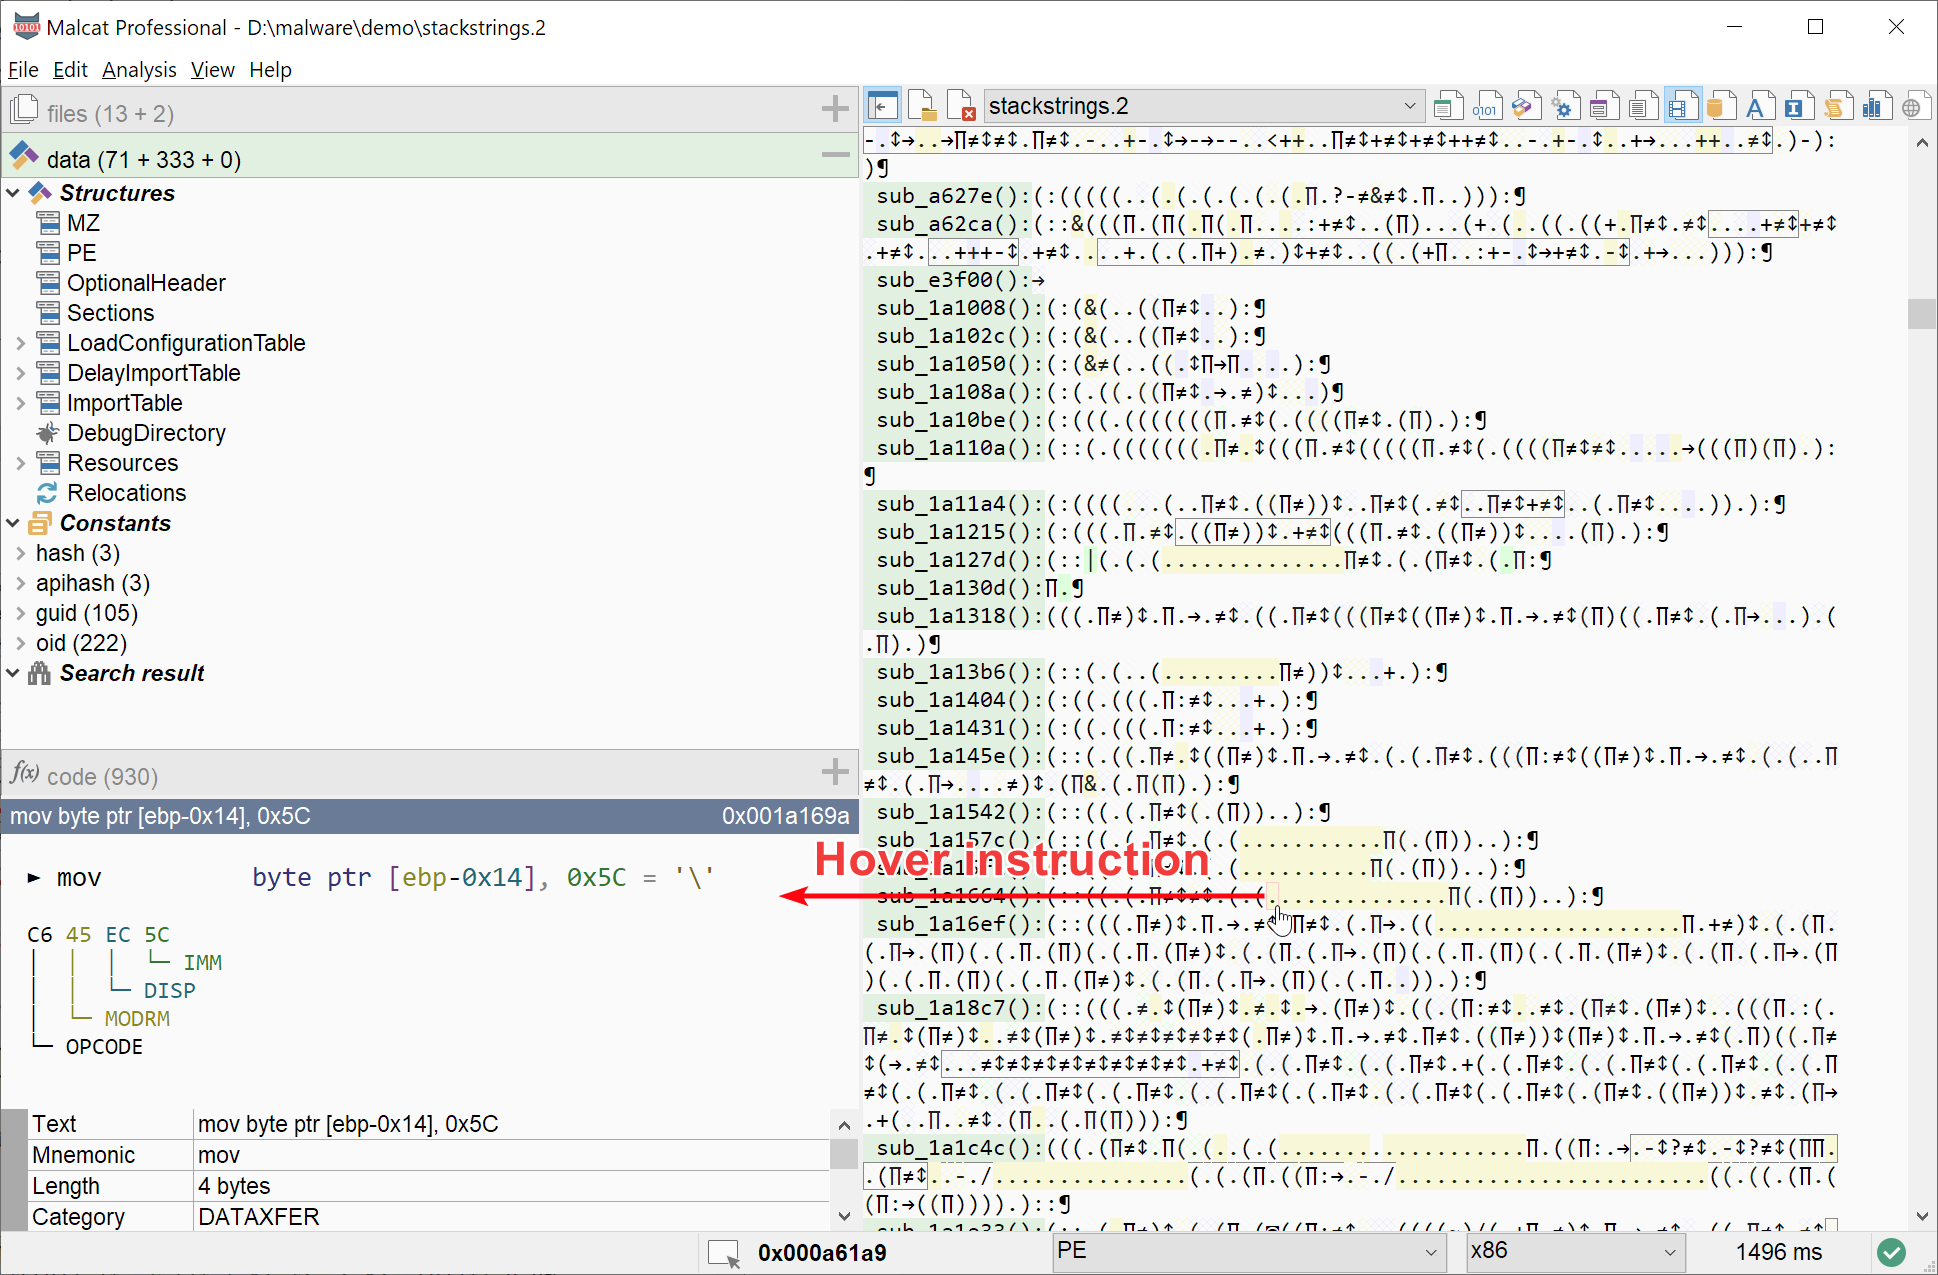
Instruction details on mouse hover
In DNA view, you can hover any symbol and the corresponding disassembly will be displayed in the quick view. This should be useful to help with the learning curve
Shortcut |
Action |
|---|---|
Tab |
Toggle on or off the different highlighting categories |
LeftClick |
Display instruction in the Disassembly view |
LeftHover |
Display instruction in the quickiew panel |
↑ |
Go back one row |
↓ |
Goto next row |
Home |
Goto first function in file |
End |
Goto last function in file |
PageUp |
Goto back one page |
PageDown |
Display next page |
Ctrl+G |
Goto address (opens a dialog) |
Backspace |
Go back |
f or F |
Goto next/previous Function |
x or X |
Goto next/previous Xref |
d or D |
Goto next/previous Difference (only in diff mode) |
Ctrl+F |
Find pattern (opens a dialog) |
Ctrl+N |
Goto next search result |
Ctrl+Shift+N |
Goto previous search result |
Symbols legend
Each instruction in the DNA view is represented using three attributes: a symbol, a color and a brush style. Let us see what they mean.
Symbols
The symbol for each instruction represents the class / group of the instruction. Groups are defined independently of the considered assembly language, i.e. they are the same for x64, .NET, pcode, NSIS, etc. The list of possible symbols is given below:
Symbol |
Meaning |
|---|---|
(space) |
nop-like opcode |
. |
assignement (to or from memory, the stack or registers) |
≠ |
comparison |
↕ |
conditional jump |
→ |
unconditional jump, direct or indirect |
∏ |
call, direct or indirect |
¶ |
return |
( |
push-like instruction, i.e saving something on the stack |
) |
pop-like instruction, i.e restoring something from the stack |
: |
other stack instruction (like frame setup, cookie, stack movements etc.) |
+ |
add-like instruction |
- |
sub-like instruction |
* |
mul-like instruction |
/ |
div-like instruction |
< |
left shift / rotate instruction |
> |
right shift / rotate instruction |
& |
and instruction |
| |
or instruction |
◙ |
xor instruction |
‰ |
floating-point instruction |
⌂ |
big-numbers instructions, like mmx |
≈ |
type cast instructions |
◊ |
privilegied instruction |
! |
invalid instruction, i.e. decoding error or instruction not supported by the current CPU |
? |
all other types of instructions |
If you’re unsure which class corresponds to which symbol, you can always hover with the mouse on a symbol and see the corresponding instruction in the quickview.
Colors
The color code of each symbol gives you informations about the type of the source operands and/or target operands of the instruction. The following types are supported:
Color |
Operand type |
|---|---|
X |
theme color 3 is used for (unresolved) symbols, e.g. API calls |
X |
theme color 2 is used for object instances. This is used for |
X |
theme color 1 is used for global variables. This is used for absolute addressing in x86 |
X |
theme color 0 is used for local variables. These are locals in .Net, or |
X (no color) |
for both immediate and register operands |
Note that these are the colors of the default theme for Malcat (vs). If you use a different theme, the colors will change.
Brush styles
The brush style used for the background color on each symbol tells you how the operand(s) is/are being accessed by the instruction. If the instruction has more than one operand, the coloring displays the (color, fill) pattern of the operand which has the higher precedence, respecting the ordering given in the color/brush tables above and below.
Brush |
Rights |
|---|---|
🮋 |
(solid color) operand is written or read and written, e.g. |
🮐 |
(cross stripes) operand is read, e.g. |
🮘 |
(diagonal stripes) operand is not accessed (addressing only, e.g. |
For instance, the instruction: add [ebp+12], 0x58 would be represented as +. The symbol + is used because it’s an add instruction. It has two operands: a constant (0x58) and a local variable ([ebp+12]). Since the coloring for the locals has precedence over the coloring for constants, the color for locals is used with a solid brush, since the local variable is written/modified by the instruction.
Highlighting
The DNA view offers a few helpers to identify interesting code patterns:
Loops, aka strongly connected components local to a function, can be outlined. Nested loops are not highlighted
API calls can be printed using the API name instead of the call symbol
string references can be displayed
known constant usage (both code constants and references to data constants) can be displayed
We suggest turning on the highlighting, as it really help spotting interesting patterns.
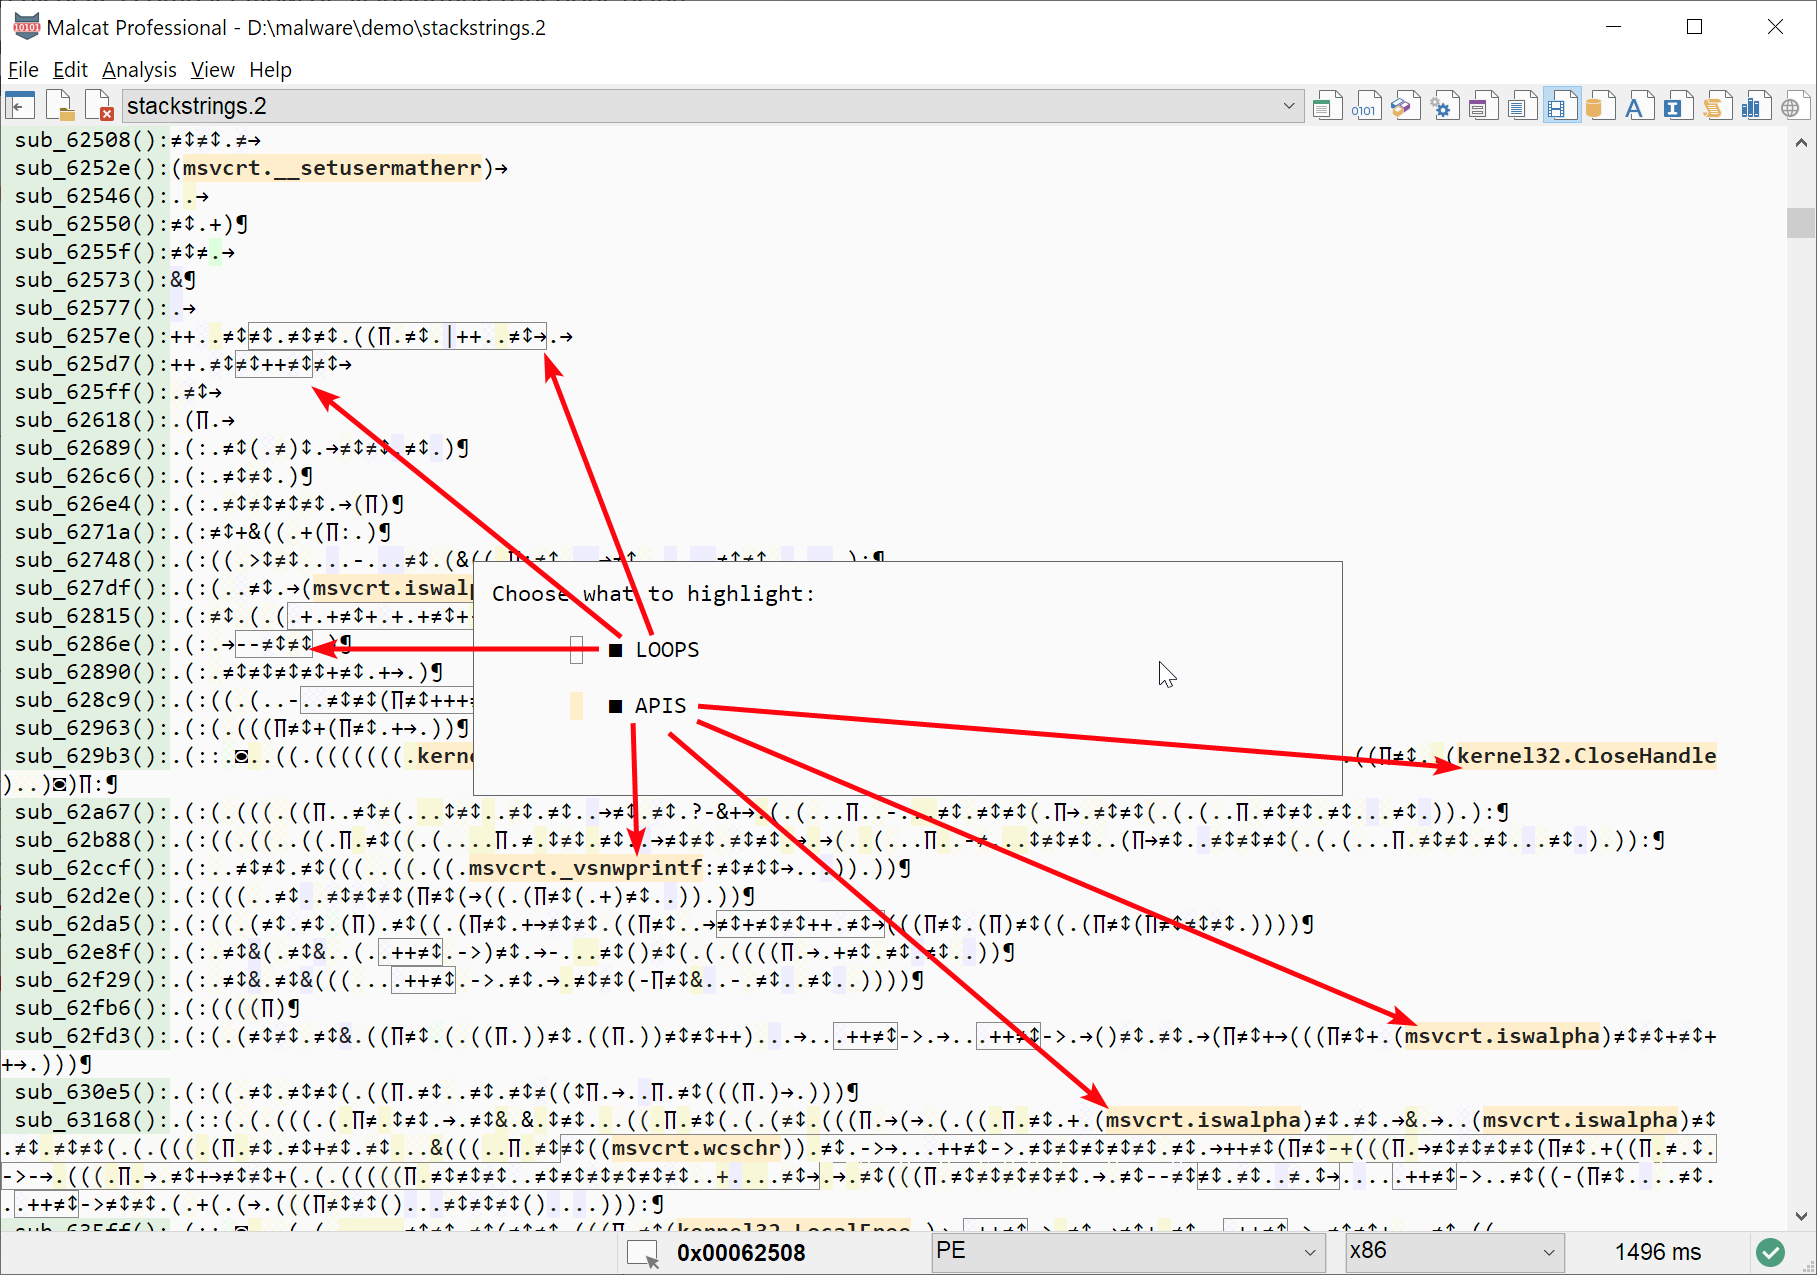
Chosing which annotations to highlight in the hexadecimal view
In the future, more flavors of highlighting may be added. If you have some ideas, don’t hesitate to share them with us, we always enjoy creative ideas.
Shortcut |
Action |
|---|---|
Tab (keep pressed) |
Display highlighting dialog |
Shift+Tab |
Highlights/unhighlight all annotations |
Use cases
Here we list some use cases where the DNA view can be useful. The list is of course not complete an many more could be found. But these are the most common ones.
Spotting crypto functions
When analyzing a malware or a crackme, crypto functions are often a good place to start your investigation. But finding them is not always a piece of cake if the program is large and you don’t know what you are looking for.
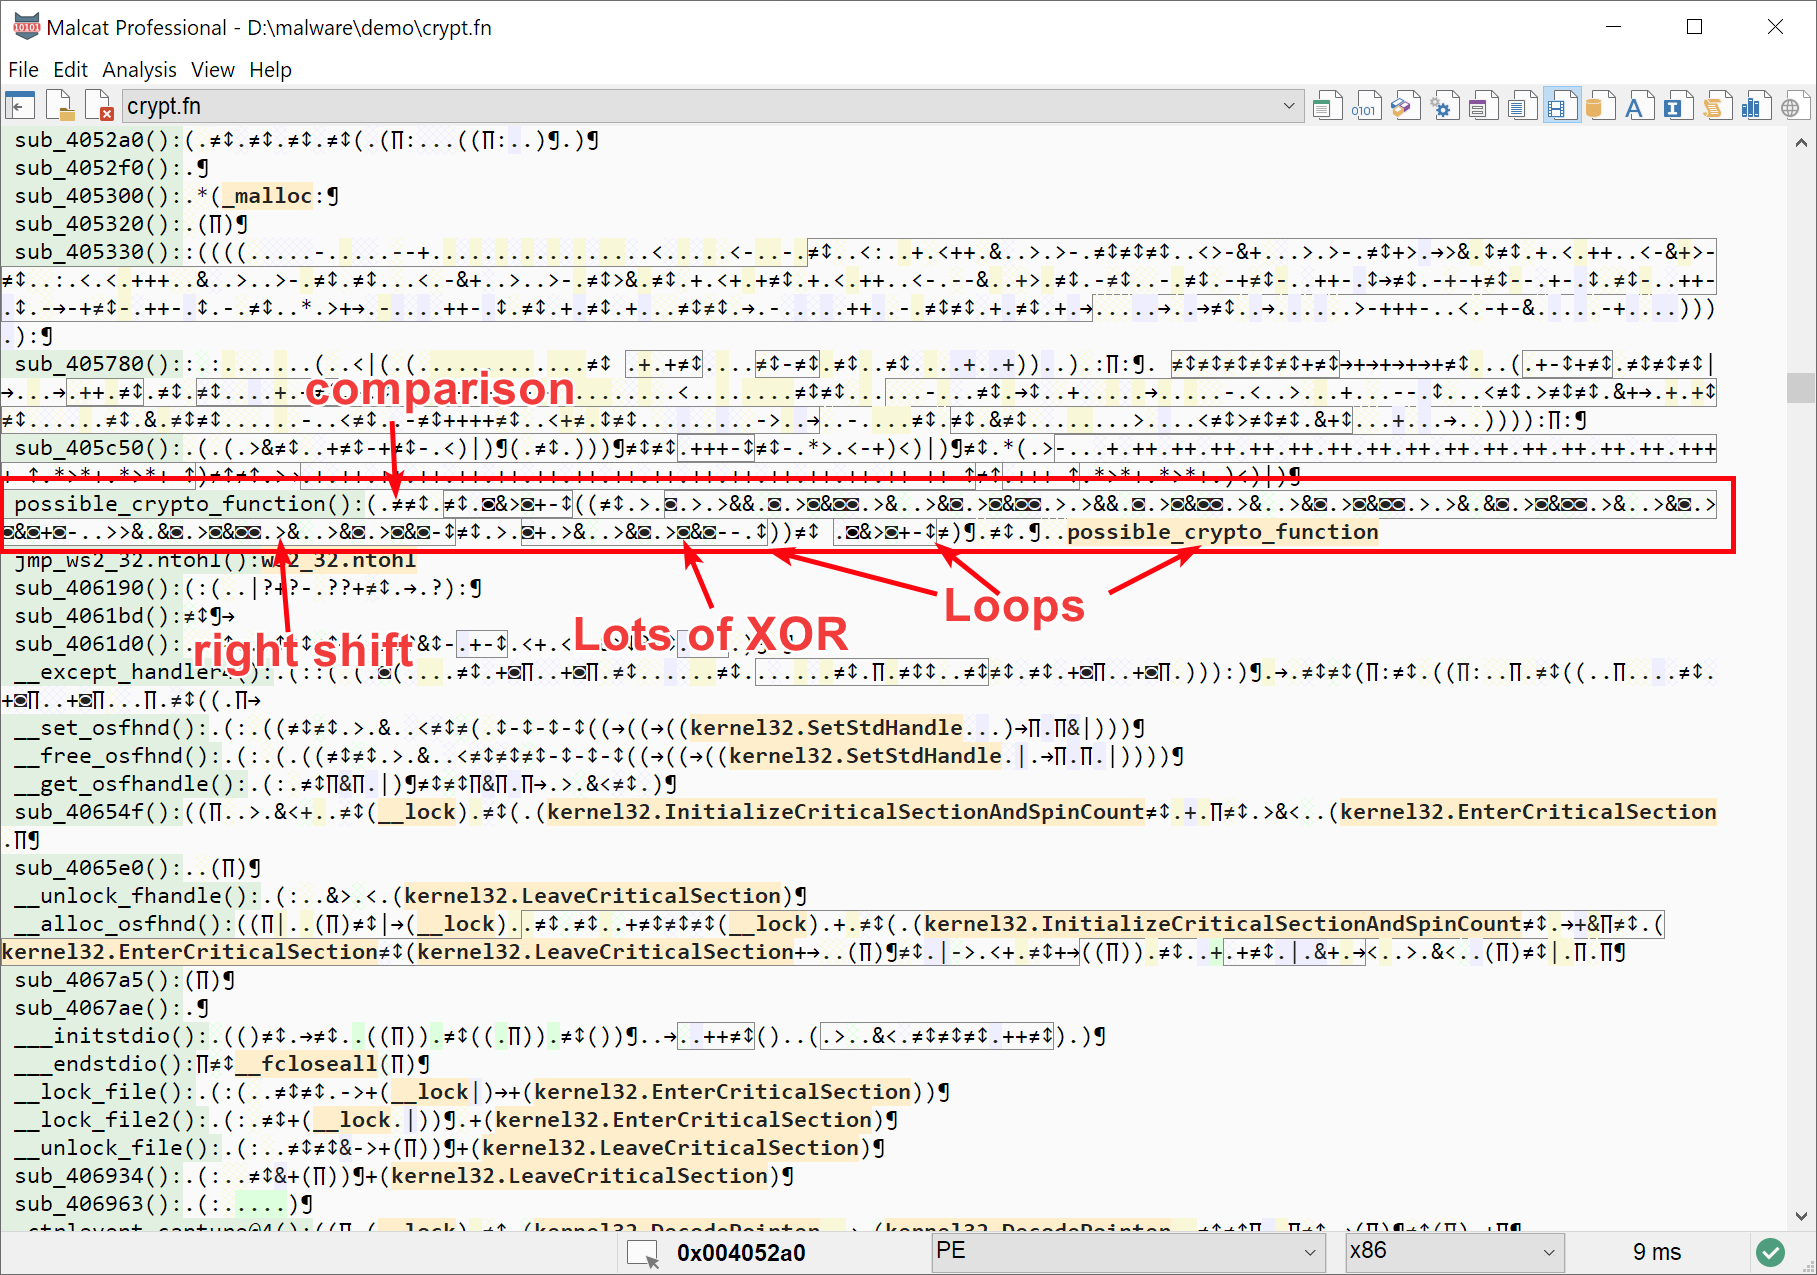
Spotting a crypto-function visually using the DNA view
By chance, a lot of crypto algorithms display the same features: at some point, a large loop doing a lot of arithmetic and binary operations is used. So in the DNA view, look for large loops contains multiple XOR (◙) or bit shifts (< or >) and you should be good.
Stack strings
While Malcat can detect most stack strings, either via its Anomaly scanner or its String analysis, it is not perfect and it may miss some weird ones. By chance, stack strings are pretty easy to detect visually from within the DNA view.
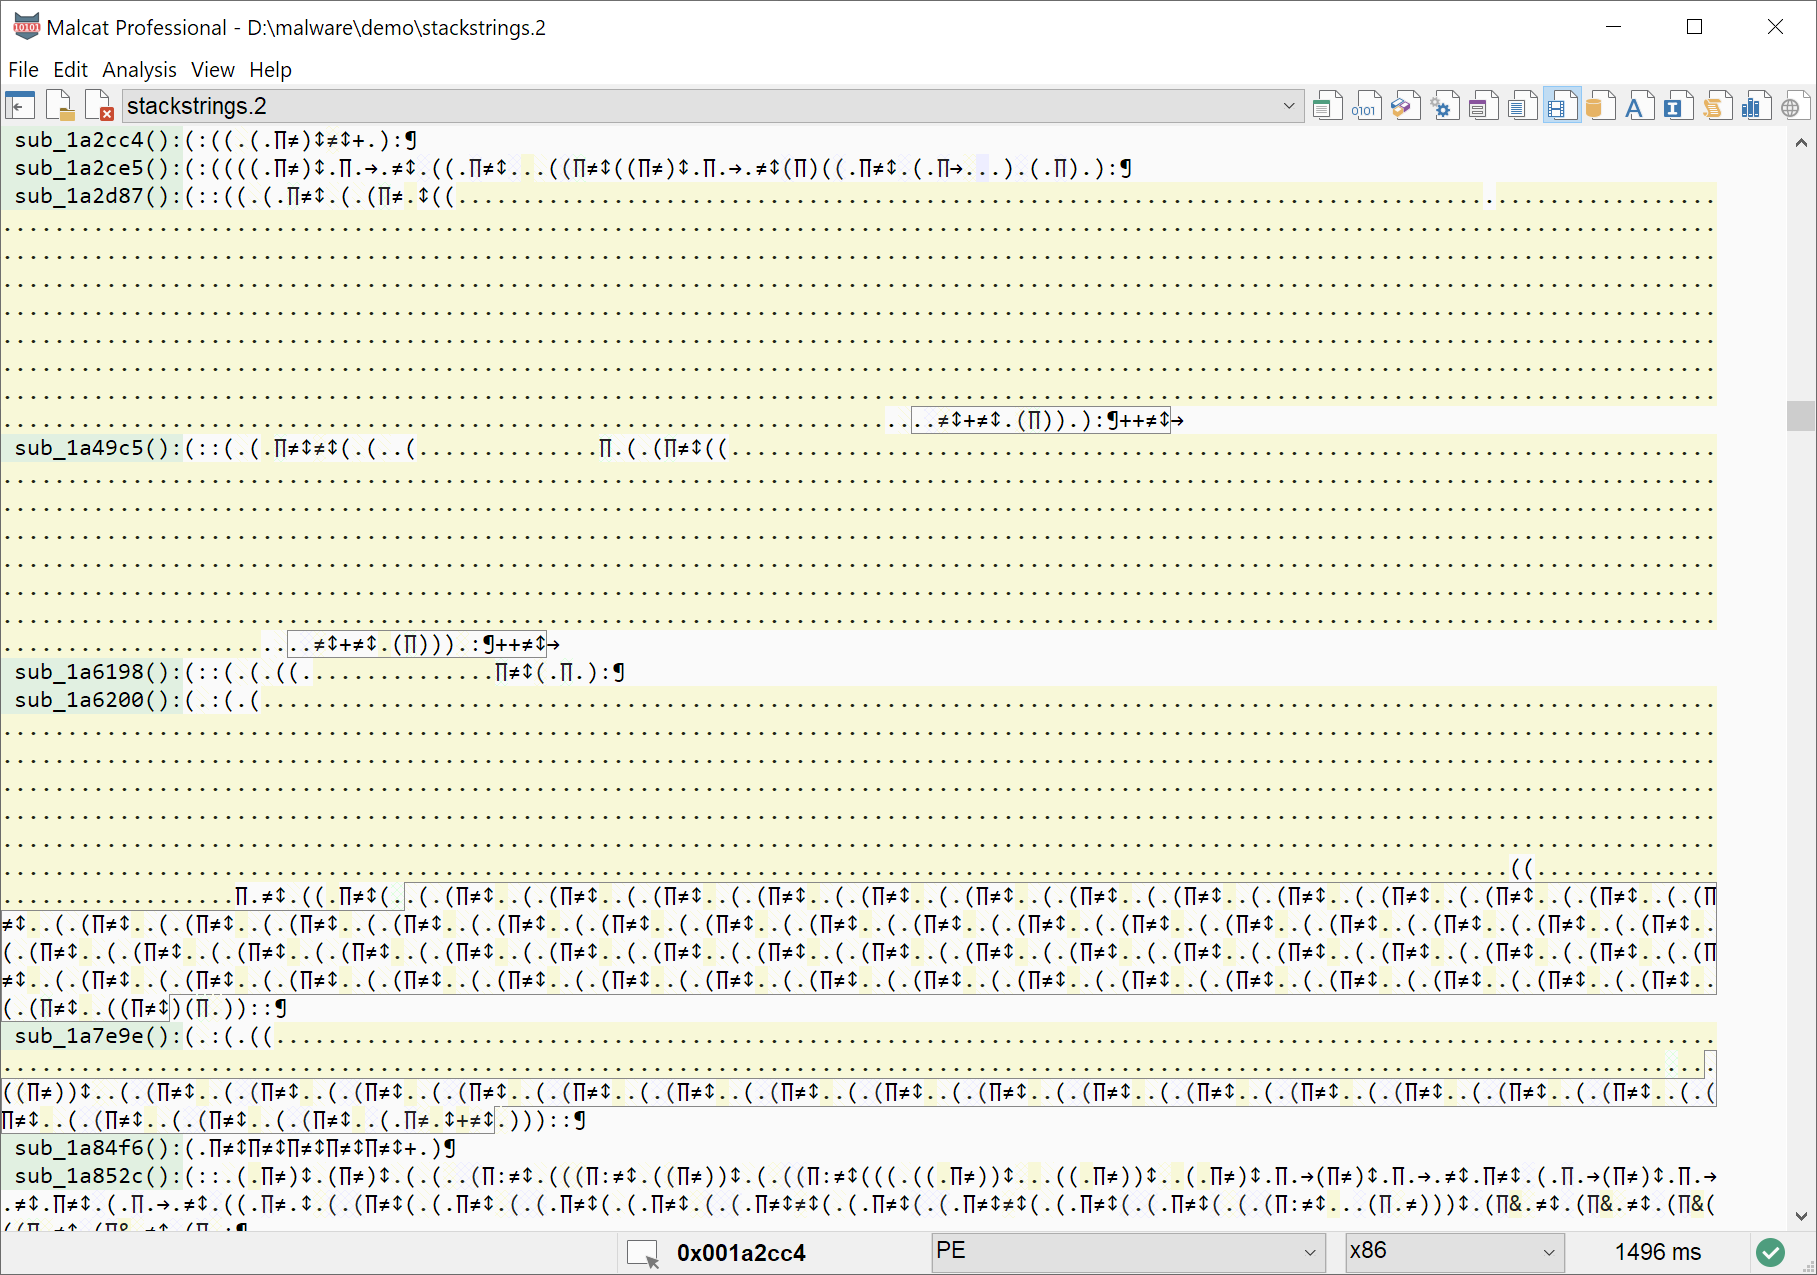
Spotting a stack writes visually using the DNA view
Just look for a long sequence of writes (i.e. the . or the ( symbol with a solid background), either to a local variable or a global variable.
Backdoored code
Sometimes malware like to modify clean programs and replace one of the function of the program with a small download-type shellcode. This kind of tampering can be hard to spot, since only a very small region of the program is malicious (think like 40-50 bytes in a 1MB program).
In this case, the DNA view can prove to be pretty useful. Such shellcodes are often encoded using polymorphic engines, and their instructions should differ a lot from the rest of the program. So in this case, just scroll through the DNA view and look for a small block which sticks out.